. 2010 Oct;38(19):6466-76.
doi: 10.1093/nar/gkq493. Epub 2010 Jun 8.

Differential regulation of full-length genome and a single-stranded 7S DNA along the cell cycle in human mitochondria

Affiliations

Differential regulation of full-length genome and a single-stranded 7S DNA along the cell cycle in human mitochondria

Anita Antes et al. Nucleic Acids Res. 2010 Oct.

Abstract

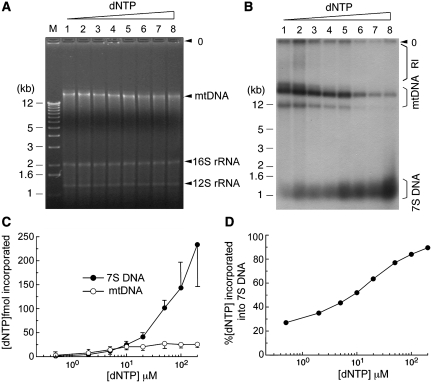
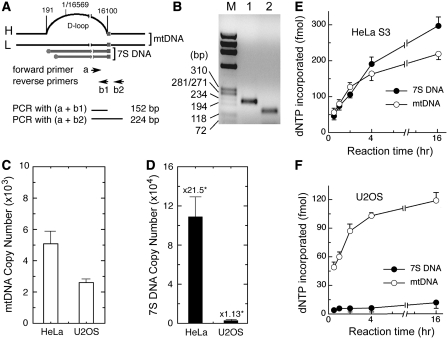
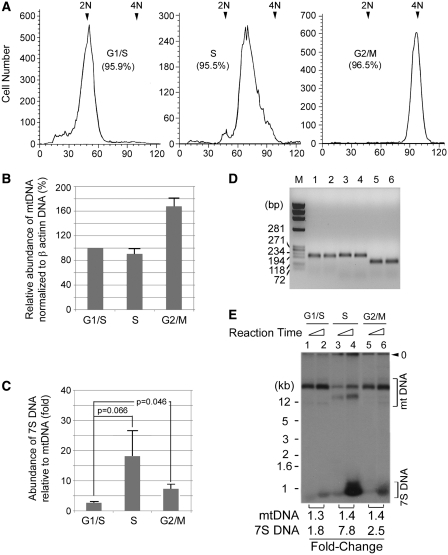
Mammalian mitochondria contain full-length genome and a single-stranded 7S DNA. Although the copy number of mitochondrial DNA (mtDNA) varies depending on the cell type and also in response to diverse environmental stresses, our understanding of how mtDNA and 7S DNA are maintained and regulated is limited, partly due to lack of reliable in vitro assay systems that reflect the in vivo functionality of mitochondria. Here we report an in vitro assay system to measure synthesis of both mtDNA and 7S DNA under a controllable in vitro condition. With this assay system, we demonstrate that the replication capacity of mitochondria correlates with endogenous copy numbers of mtDNA and 7S DNA. Our study also shows that higher nucleotide concentrations increasingly promote 7S DNA synthesis but not mtDNA synthesis. Consistently, the mitochondrial capacity to synthesize 7S DNA but not mtDNA noticeably varied along the cell cycle, reaching its highest level in S phase. These findings suggest that syntheses of mtDNA and 7S DNA proceed independently and that the mitochondrial capacity to synthesize 7S DNA dynamically changes not only with cell-cycle progression but also in response to varying nucleotide concentrations.


Figures

Figure 1.
Figure 1.
Analysis of de novo synthesized DNA. (A) Control replication reactions were carried out in the standard reaction mixture (50 µl), as described in ‘Materials and Methods' section, with either 100 µg of cytoplasmic extract (C1–C4) (lanes 1–4, respectively) or 50 µg of nuclear extract (N1 & N2) (lanes 5 and 6), but omitting the template DNA, pSLVD (Supplementary Figure S1). Procedures employed for the preparation of C1-4 and N1-2 are detailed in ‘Material and Methods’ section. DNA, isolated by conventional phenol/chloroform extraction and ethanol precipitation, was resolved on a 1% agarose gel. Subsequently, de novo synthesized DNA was visualized by autoradiography. (B) Predicted cleavage sites for the indicated restriction enzymes in human mitochondrial DNA (GenBank AC000021). Asterisk indicates a single nucleotide polymorphism at position 11 347, which is found in 3 out of 2704 mtDNA sequences (http://www.genpat.uu.se/mtDB/). (C) DNA was digested for 1 h with Xho I (lane 2), Hpa I (lane 4) or Xho I and Nhe I (lane 5). In (A) and (C), the gel well is indicated as ‘o’. (D) Reactions (in triplicate) for mtDNA synthesis were carried out using the standard reaction mixture provided with 100 µg of HeLa CE in the presence of aphidicolin (100 µg/ml, lane 2), ddATP (20 or 100 µM, lanes 3–4) or DMSO (4%, lane 5). De novo synthesized DNA was quantified using a PhosphorImager. In the control reaction in (lane 1), 100% indicates the incorporation of 34 fmol α-32P-dATP into full-length mtDNA.
Figure 2.
Figure 2.
An optimal reaction condition for 7S DNA synthesis in vitro. (A) Replication–competent CE (lane 1) was subjected to four consecutive centrifugations at 10 000g for 1 min. The clear supernatant (lane 3) obtained after the first centrifugation was stored, while the pellet (lane 2), enriched in mitochondria, was re-suspended in buffer G after four rounds of centrifugation. Subcellular fractions, including NE (lane 4), were analyzed by western blotting for the indicated protein with the following aliquots: lane 1, 15 µg of CE; lane 2, 4.2 µg of mitochondria fraction; lane 3, 15 µg of clear CE; lane 4, 10.8 µg of NE. (B) A duplicate set of replication reactions was performed in the standard mixture provided with replication–competent HeLa CE. After 2 h incubation, reaction mixtures were subjected to repeated centrifugations, as described in (A). After the final centrifugation, the pellets were treated with SDS (0.5%) and proteinase K (0.25 mg/ml) in a final volume of 12 µl. Following 30 min incubation at 37°C, the lysates were directly loaded on an agarose gel, and de novo synthesized DNAs were resolved by electrophoresis and visualized by autoradiography. O, the gel well. RI, replication intermediates.
Figure 3.
Figure 3.
Influence of nucleotide concentration on in vitro synthesis of 7S DNA and mtDNA. Replication reactions were performed with HeLa CE (∼1.5 × 10⁵ cell equivalent) in the presence of variable equimolar dNTP levels: lane 1, 0.5 µM dNTP/5 µCi α-32P-dATP; lanes 2–4, 2, 5 or 10 µM dNTP/10 µCi α-32P-dATP; lanes 5–7, 20, 50 or 100 µM dNTP/20 µCi α-32P-dATP; lane 8, 200 µM dNTP/40 µCi α-32P-dATP. For each reaction, the specific radioactivity per µM dNTP is estimated as follows: lane 1, 2.2 × 10⁷ cpm; lane 2, 1.1 × 10⁷ c.p.m.; lane 3, 4.4 × 10⁶ c.p.m.; lanes 4–5, 2.2 × 10⁶ c.p.m.; lane 6, 8.8 × 10⁵ c.p.m.; lanes 7–8, 4.4 × 10⁵ c.p.m. After 2 h incubation, reaction mixtures were resolved on a 1% agarose gel, as described in ‘Materials and Methods' section. Position of mtDNA and two mitochondrial ribosomal DNAs, 16S and 12S rRNA, are indicated in (A). Immediately after photography, the gel was dried and then subjected to autoradiography to detect newly synthesized 7S DNA, mtDNA and replication intermediates (RI), as shown in (B). Nucleotide incorporation into mtDNA and 7S DNA was quantified as described in 'Materials and methods' section and average values obtained from four independent experiments are presented in (C). (D) Nucleotide incorporation into 7S DNA is presented relative to total dNTP incorporation (i.e. 7S DNA + full-length mtDNA).
Figure 4.
Figure 4.
Comparative analysis of endogenous levels of mtDNA/7S DNA and the mitochondrial capacity to synthesize mtDNA/7S DNA measured in vitro. (A) RT–qPCR was performed to measure endogenous levels of mtDNA and 7S DNA using the primer pairs (a+b1) and (a+b2), respectively. Schematic diagram indicates relative positions of PCR primers and expected PCR products. Numbers on top of mtDNA show nucleotide positions. (B) An aliquot (5 µl) of a representative PCR reaction provided with the primer pair (a+b2) (lane 1) or (a+b1) (lane 2) was analyzed on a 2% agarose gel and DNA was visualized by EtBr staining. ϕX174 DNA-Hae III digests, used as a molecular standard, are indicated (M). (C and D) RT–qPCR was performed with aliquots of diluted CE, equivalent to ∼300 HeLa cells or ∼59 U2OS cells. Average copy numbers of mtDNA (C) and 7S DNA (D) were obtained from two independent duplicate experiments. In (D), numbers on top of each bar indicate fold-abundance of 7S DNA relative to mtDNA. (E–F) Replication reactions were carried out with aliquots of HeLa CE (∼1.5 × 10⁵ cell equivalents) or U2OS CE (∼5 × 10⁵ cell equivalents). The extent of dNTP incorporation into mtDNA and 7S DNA, obtained from two independent duplicate experiments, is presented.
Figure 5.
Figure 5.
Comparative analysis of mtDNA replication and 7S DNA synthesis in vivo. (A) Aliquots of HeLa cells (∼1 × 10⁴ cells) synchronized at the indicated stage of the cell cycle were subjected to FACS analysis. The extent of cell synchrony is presented as percent in parenthesis. (B–D) The copy number of β-actin gene was determined by RT–qPCR, to which mtDNA copy number was normalized (B). Fold ratio of 7S DNA to mtDNA at different stages of the cell cycle, as determined by qPCR, is presented in (C) where SD and the two-tailed Student’s t-test probabilities of three independent experiments are shown. (D) Aliquots (5 µl) of two representative RT–qPCR reactions provided with the primer pair for mtDNA (lanes 1–2), β-actin gene (lanes 3–4), or 7S DNA (lanes 5–6), were analyzed on a 2% agarose gel. (E) The mitochondrial capacity to synthesize mtDNA and 7S DNA was determined with aliquots (5 µl) of replication competent CE prepared from HeLa cells synchronized at the indicated stage of the cell cycle. After 2 h or 14 h incubation, reaction mixtures were resolved on a 1% agarose gel. Positions of mtDNA and 7S DNA are indicated.

Similar articles

Cited by

References

    1. Anderson S, Bankier AT, Barrell BG, de Bruijn MH, Coulson AR, Drouin J, Eperon IC, Nierlich DP, Roe BA, Sanger F, et al. Sequence and organization of the human mitochondrial genome. Nature. 1981;290:457–465. - PubMed
    1. Copeland WC. Inherited mitochondrial diseases of DNA replication. Annu. Rev. Med. 2008;59:131–146. - PMC - PubMed
    1. Schapira AH. Mitochondrial disease. Lancet. 2006;368:70–82. - PubMed
    1. Schon EA. Mitochondrial genetics and disease. Trends Biochem. Sci. 2000;25:555–560. - PubMed
    1. Takamatsu C, Umeda S, Ohsato T, Ohno T, Abe Y, Fukuoh A, Shinagawa H, Hamasaki N, Kang D. Regulation of mitochondrial D-loops by transcription factor A and single-stranded DNA-binding protein. EMBO Rep. 2002;3:451–456. - PMC - PubMed