. 2010 Sep;9(9):1829-48.
doi: 10.1074/mcp.M110.001651. Epub 2010 Jun 8.

Protein analysis of purified respiratory syncytial virus particles reveals an important role for heat shock protein 90 in virus particle assembly

Affiliations

Protein analysis of purified respiratory syncytial virus particles reveals an important role for heat shock protein 90 in virus particle assembly

Anuradha Radhakrishnan et al. Mol Cell Proteomics. 2010 Sep.

Abstract

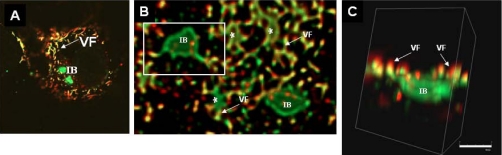
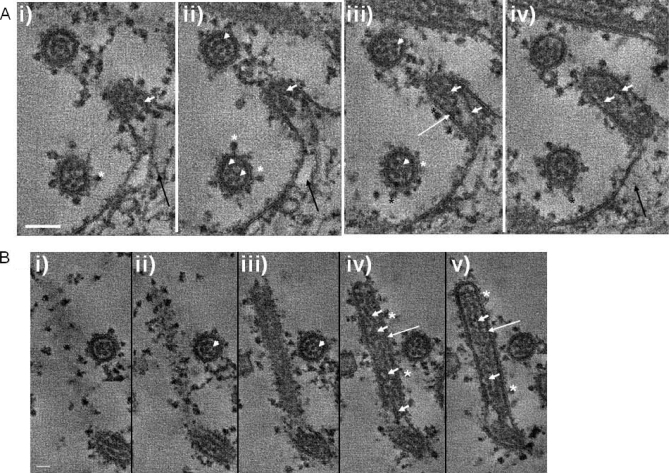
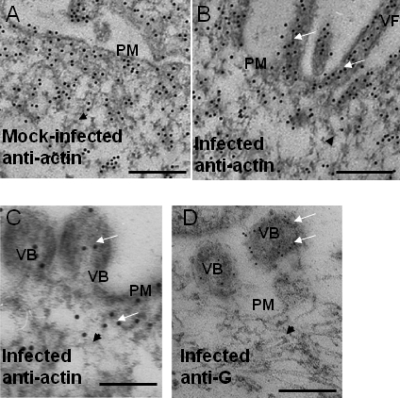
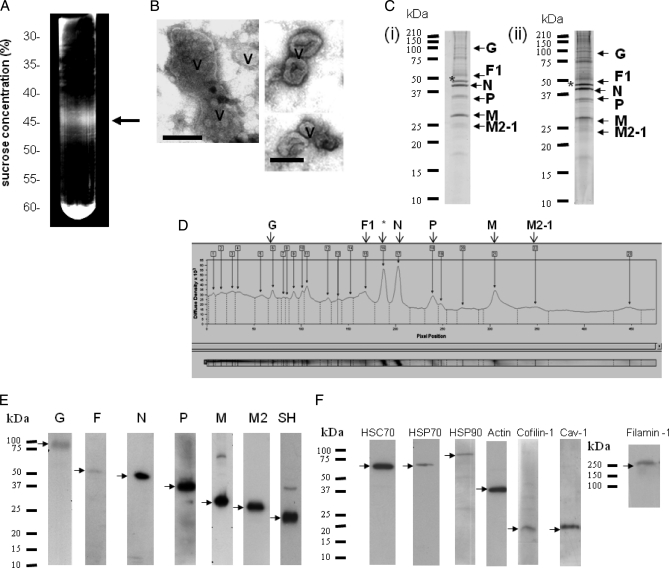
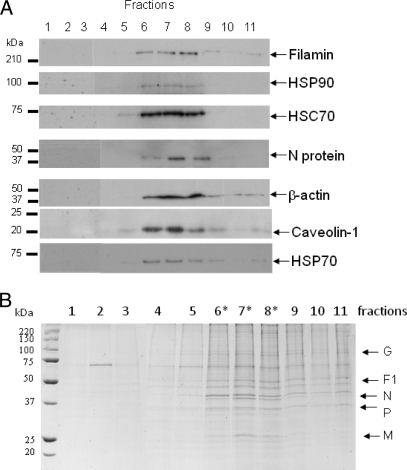
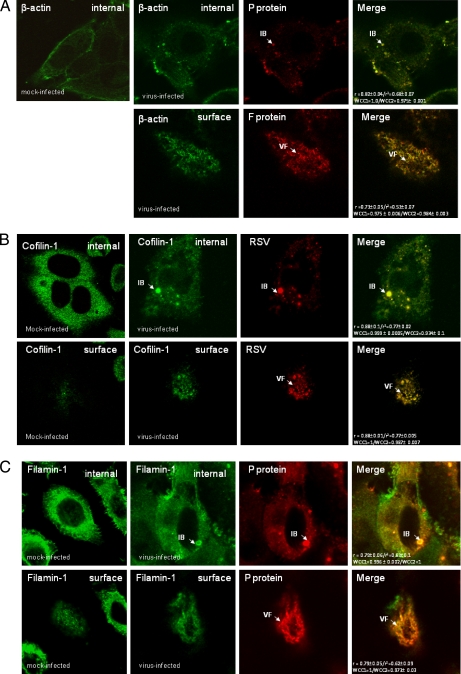
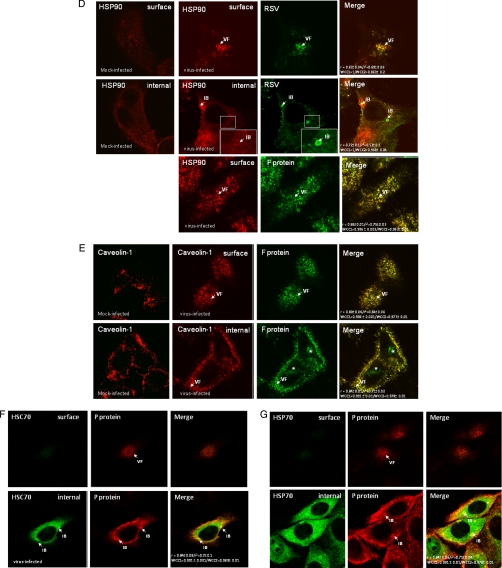
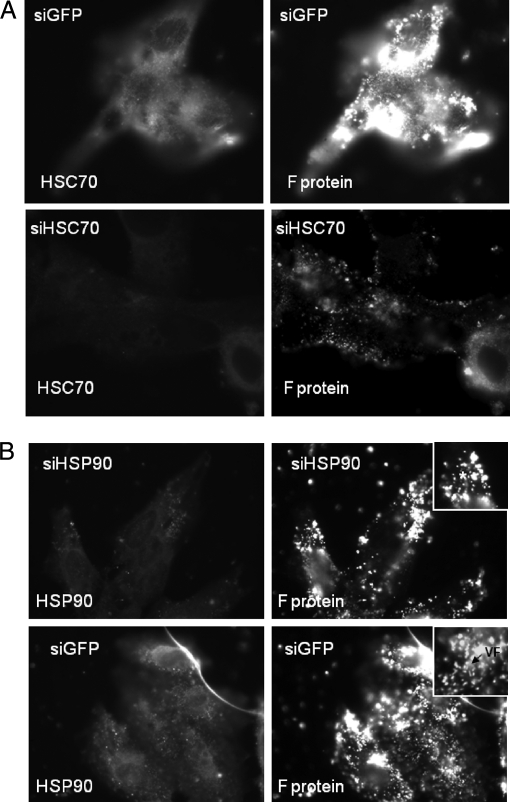
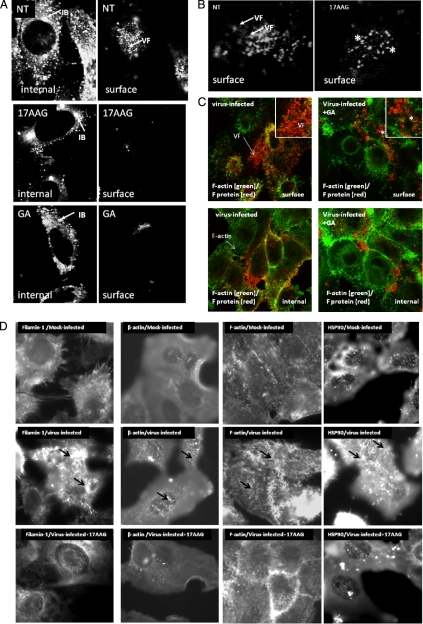
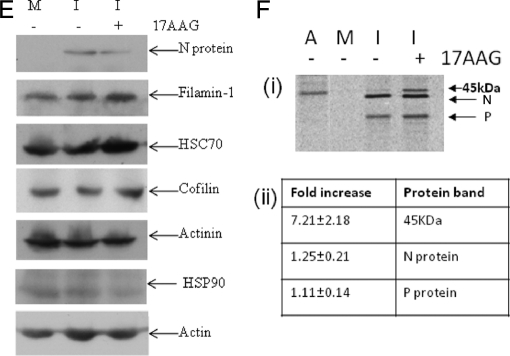
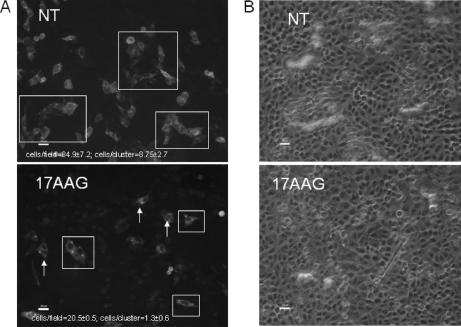
In this study, we used imaging and proteomics to identify the presence of virus-associated cellular proteins that may play a role in respiratory syncytial virus (RSV) maturation. Fluorescence microscopy of virus-infected cells revealed the presence of virus-induced cytoplasmic inclusion bodies and mature virus particles, the latter appearing as virus filaments. In situ electron tomography suggested that the virus filaments were complex structures that were able to package multiple copies of the virus genome. The virus particles were purified, and the protein content was analyzed by one-dimensional nano-LC MS/MS. In addition to all the major virus structural proteins, 25 cellular proteins were also detected, including proteins associated with the cortical actin network, energy pathways, and heat shock proteins (HSP70, HSC70, and HSP90). Representative actin-associated proteins, HSC70, and HSP90 were selected for further biological validation. The presence of beta-actin, filamin-1, cofilin-1, HSC70, and HSP90 in the virus preparation was confirmed by immunoblotting using relevant antibodies. Immunofluorescence microscopy of infected cells stained with antibodies against relevant virus and cellular proteins confirmed the presence of these cellular proteins in the virus filaments and inclusion bodies. The relevance of HSP90 to virus infection was examined using the specific inhibitors 17-N-Allylamino-17-demethoxygeldanamycin. Although virus protein expression was largely unaffected by these drugs, we noted that the formation of virus particles was inhibited, and virus transmission was impaired, suggesting an important role for HSP90 in virus maturation. This study highlights the utility of proteomics in facilitating both our understanding of the role that cellular proteins play during RSV maturation and, by extrapolation, the identification of new potential targets for antiviral therapy.


Figures

Fig. 1.
Fig. 1.
Association of virus filaments and inclusion bodies in virus-infected cells. Virus-infected cells were labeled using antibodies to P protein (green) and F protein (red). A series of images was obtained from the same cell at different focal planes in the Z-axis by confocal microscopy. The Z-stacks were then processed and visualized in three-dimensional as described under “Experimental Procedures.” A is a single optical slice visualized in parallel to the substrate and viewed two-dimensionally. B is a low magnification deconvolved image showing a region near the surface of the cell, again parallel to the substrate. The inclusion body (IB) can be seen to be irregular in shape and labeled only by anti-P, whereas the virus filaments (VF) are labeled by both anti-P and anti-F. C is a higher magnification image within the cell showing an individual inclusion body and its associated virus filaments. The three-dimensional projection has now been rotated through 90° and tilted slightly, showing that the filaments are predominantly above the inclusion body and in a vertical orientation. * highlights the smaller sized inclusion body.
Fig. 2.
Fig. 2.
TEM tomography of virus-infected cells. Infected cells were embedded in Epon and processed as described under “Experimental Procedures.” In each case, consecutive images from two tomograms at different planes through the section are shown, providing an image series at 11-nm intervals through the infected cells. In each case, plate i is a view closer to the top of the section, and subsequent plates ii–iv (A) and ii–v (B) are views progressing through the section. A shows the relationship between the newly assembled virus filaments and the cell surface, in particular the packaging of the virus RNP into a virus filament. B is a longitudinal cross-section through a virus filament showing the distribution of the RNPs in the virus filament. Also seen in both A and B is a virus filament viewed in radial cross-section where the RNPs are highlighted by white arrowheads. The virus envelope proteins (*), electron-dense M protein layer beneath the surface of the filaments (long white arrows), RNPs within the virus filaments (short white arrows), and cortical cytoskeleton (black arrows) are highlighted. Scale bars, 100 (A) and 50 nm (B).
Fig. 3.
Fig. 3.
Immuno-TEM of infected cells. Mock-infected and infected cells were embedded in Unicryl, and thin sections were prepared. These labeled with either anti-actin (A–C) or anti-G (D), and the presence of bound antibody was visualized using anti-mouse IgG conjugated to either 10- or 5-nm colloidal gold, respectively. The virus filaments (VF), plasma membrane (PM), and budding virus (VB) are highlighted. The cortical actin network (black arrowheads) and colloidal gold particles (white arrows) are indicated. Scale bar, 400 (A and B) and 200 nm (C and D).
Fig. 4.
Fig. 4.
Purification of virus particles by sucrose gradient centrifugation. A, RSV was purified as described under “Experimental Procedures.” At the final stage, the virus was applied to a 30–60% continuous sucrose gradient, the virus band was detected using a focused light, and the band was harvested (indicated by a black arrow). B, the material in the virus band was viewed by negative staining using an electron microscope (bar, 100 nm), and the presence of virus particles (V) was demonstrated. C, the proteins in the pooled virus fraction were separated by SDS-PAGE, and proteins were visualized in the polyacrylamide gel viewed after Coomassie Brilliant Blue (i) or SYPRO Ruby Red (ii) staining. Protein bands whose sizes correspond to known virus bands are labeled. *, this protein was identified as β-actin by MALDI-TOF/TOF analysis. D, the SYPRO Ruby Red-stained polyacrylamide gel was scanned using a densitometer to determine the relative abundance of proteins detected. Confirmation of the presence of either virus (E) or specific host cell (F) proteins in the virus preparation by immunoblotting is shown. Protein bands corresponding in size to the respective virus or host cell proteins are indicated (black arrows).
Fig. 5.
Fig. 5.
Co-migration of host cell proteins identified by MS/MS analysis and RSV N protein. The 30–60% continuous sucrose gradient was fractionated, the proteins in the individual gradient fractions were separated by SDS-PAGE, and either the presence of specific proteins was detected by immunoblotting using antibodies against filamin-1, HSP90, HSC70, β-actin, HSP70, caveolin-1, and the RSV N protein (Fraction 1, top; Fraction 11, bottom) (A) or the total proteins were visualized in the SYPRO Ruby Red-stained polyacrylamide gel (B). * indicates the peak virus fractions.
Fig. 6.
Fig. 6.
Validation of association with virus structures in infected cells. Cells were either mock- or virus-infected, and at 24 hpi, the cells were fixed and stained using β-actin and either anti-P or anti-F (A), anti-cofilin-1 and anti-RSV (B), anti-filamin-1 and anti-P (C), anti-HSP90 and either anti-RSV or anti-F (D), anti-caveolin-1 and anti-F (E), anti-HSC70 and anti-P (F), and anti-HSP70 and anti-P (G). The merged images showing both distributions in the same image are shown, and co-localization in the merged image is indicated by the yellow staining pattern and quantified using the correlation coefficient and Pearson's coefficients. The cells were viewed in a confocal microscope at optical planes representing predominantly the cell interior (internal) or surface. Golgi staining of the F protein (*), the inclusion bodies (IB), and virus filaments (VF) is highlighted.
Fig. 6.
Fig. 6.
Validation of association with virus structures in infected cells. Cells were either mock- or virus-infected, and at 24 hpi, the cells were fixed and stained using β-actin and either anti-P or anti-F (A), anti-cofilin-1 and anti-RSV (B), anti-filamin-1 and anti-P (C), anti-HSP90 and either anti-RSV or anti-F (D), anti-caveolin-1 and anti-F (E), anti-HSC70 and anti-P (F), and anti-HSP70 and anti-P (G). The merged images showing both distributions in the same image are shown, and co-localization in the merged image is indicated by the yellow staining pattern and quantified using the correlation coefficient and Pearson's coefficients. The cells were viewed in a confocal microscope at optical planes representing predominantly the cell interior (internal) or surface. Golgi staining of the F protein (*), the inclusion bodies (IB), and virus filaments (VF) is highlighted.
Fig. 7.
Fig. 7.
The effect of HSC70 and HSP90 expression on RSV replication is shown. Cells were transfected with siGFP or siHSC70 (A) or siGFP or siHSP90 (B). At 36 h post-transfection, the cells were infected with RSV using an m.o.i. of 1, and at 20 hpi, the cells were fixed and either stained using anti-F and anti-HSC70 (A) or stained with anti-F (MAb19) and anti-HSP90 (B). Insets, enlarged images showing the F protein staining pattern in siGFP- and siHSP90-tranfected cells. In all cases, the stained cells were imaged at ×100 (oil immersion) with a Nikon ECLIPSE TE2000-U using appropriate machine settings and identical exposure times. VF, virus filaments; * highlights the punctate F protein staining pattern in siHSP90 treated cells.
Fig. 8.
Fig. 8.
Effect of HSP90 on progeny virus formation. Infected cells were either non-treated (NT) or treated with 17AAG or GA, and at 24 hpi, the cells were fixed and stained with either anti-RSV (A) or MAb19 (B). C, infected cells were either non-treated or GA-treated and stained using phalloidin-FITC (to visualize the F-actin network) and MAb19. The cells were then viewed in a confocal microscope (×64; oil immersion) at optical planes representing predominantly either the cell interior (internal) or surface. Insets, enlarged images showing the F protein staining pattern in non-treated and drug-treated cells. D, mock-infected, virus-infected, and virus-infected cells treated with 17AAG were stained using anti-β-actin, phalloidin-FITC, anti-filamin, and anti-HSP90, and the cells were imaged at ×100 (oil immersion) using a Nikon ECLIPSE TE2000-U. E, mock-infected and virus-infected cells (I), either non-treated (−) or treated (+) with 17-AAG, were harvested at 18 hpi and examined by immunoblot using relevant antibodies. The respective proteins are highlighted. F, mock-infected and virus-infected cells (I), either non-treated (−) or treated (+) with 17-AAG, were radiolabeled with [35S]methionine between 8 and 18 hpi. Lysates were prepared and immunoprecipitated using either anti-RSV or anti-β-actin and then examined by SDS-PAGE (i). The presence of the N and P proteins are indicated, and the presence of an additional band corresponding in size to actin was also found in the treated cells. Immunoprecipitation of mock-infected cells (M) using anti-RSV or actin (A) is also shown. ii, the radiolabeled bands in the non-treated and 17AAG-treated virus-infected cells were quantified by densitometry, which allowed determination of the -fold increase of the relevant protein bands in the 17AAG-treated cells compared with the non-treated cells.
Fig. 8.
Fig. 8.
Effect of HSP90 on progeny virus formation. Infected cells were either non-treated (NT) or treated with 17AAG or GA, and at 24 hpi, the cells were fixed and stained with either anti-RSV (A) or MAb19 (B). C, infected cells were either non-treated or GA-treated and stained using phalloidin-FITC (to visualize the F-actin network) and MAb19. The cells were then viewed in a confocal microscope (×64; oil immersion) at optical planes representing predominantly either the cell interior (internal) or surface. Insets, enlarged images showing the F protein staining pattern in non-treated and drug-treated cells. D, mock-infected, virus-infected, and virus-infected cells treated with 17AAG were stained using anti-β-actin, phalloidin-FITC, anti-filamin, and anti-HSP90, and the cells were imaged at ×100 (oil immersion) using a Nikon ECLIPSE TE2000-U. E, mock-infected and virus-infected cells (I), either non-treated (−) or treated (+) with 17-AAG, were harvested at 18 hpi and examined by immunoblot using relevant antibodies. The respective proteins are highlighted. F, mock-infected and virus-infected cells (I), either non-treated (−) or treated (+) with 17-AAG, were radiolabeled with [35S]methionine between 8 and 18 hpi. Lysates were prepared and immunoprecipitated using either anti-RSV or anti-β-actin and then examined by SDS-PAGE (i). The presence of the N and P proteins are indicated, and the presence of an additional band corresponding in size to actin was also found in the treated cells. Immunoprecipitation of mock-infected cells (M) using anti-RSV or actin (A) is also shown. ii, the radiolabeled bands in the non-treated and 17AAG-treated virus-infected cells were quantified by densitometry, which allowed determination of the -fold increase of the relevant protein bands in the 17AAG-treated cells compared with the non-treated cells.
Fig. 9.
Fig. 9.
Inhibiting HSP90 activity impairs cell transmission of RSV. Cells were infected using an m.o.i. of 0.1, and at 8 hpi, the cells were treated with 17AAG. At 30 hpi, the cells were fixed and stained using anti-RSV. The same cell area was viewed at ×20 magnification using fluorescence (A) and bright field (B) microscopy. The presence of clusters of labeled cells (white boxes) or individual labeled cells (white arrows) are highlighted. Scale bar, 20 μm. The average numbers of stained cells per image and the average numbers of stained cells per cluster (highlighted by white boxes) were estimated in both non-treated and 17AAG-treated cells. NT, non-treated.

Similar articles

Cited by

References

    1. Norrby E., Marusyk H., Orvell C. (1970) Morphogenesis of respiratory syncytial virus in a green monkey kidney cell line (Vero). J. Virol. 6, 237–242 - PMC - PubMed
    1. Grosfeld H., Hill M. G., Collins P. L. (1995) RNA replication by respiratory syncytial virus (RSV) is directed by the N, P, and L proteins; transcription also occurs under these conditions but requires RSV superinfection for efficient synthesis of full-length mRNA. J. Virol. 69, 5677–5686 - PMC - PubMed
    1. Yu Q., Hardy R. W., Wertz G. W. (1995) Functional cDNA clones of the human respiratory syncytial (RS) virus N, P, and L proteins support replication of RS virus genomic RNA analogs and define minimal trans-acting requirements for RNA replication. J. Virol. 69, 2412–2419 - PMC - PubMed
    1. Collins P. L., Hill M. G., Cristina J., Grosfeld H. (1996) Transcription elongation factor of respiratory syncytial virus, a nonsegmented negative-strand RNA virus. Proc. Natl. Acad. Sci. U.S.A. 93, 81–85 - PMC - PubMed
    1. Hardy R. W., Wertz G. W. (1998) The product of the respiratory syncytial virus M2 gene ORF1 enhances readthrough of intergenic junctions during viral transcription. J. Virol. 72, 520–526 - PMC - PubMed

Publication types

MeSH terms

Substances