. 2010 Aug;299(2):E325-34.
doi: 10.1152/ajpendo.00145.2010. Epub 2010 Jun 8.

The mechanism of ascorbic acid-induced differentiation of ATDC5 chondrogenic cells

Affiliations

The mechanism of ascorbic acid-induced differentiation of ATDC5 chondrogenic cells

Tecla M Temu et al. Am J Physiol Endocrinol Metab. 2010 Aug.

Abstract

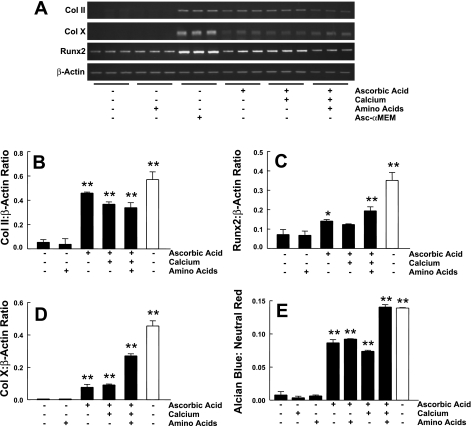
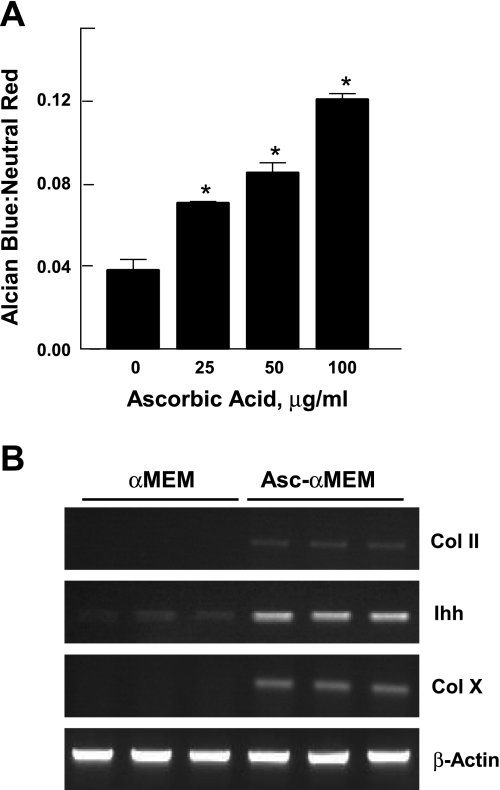
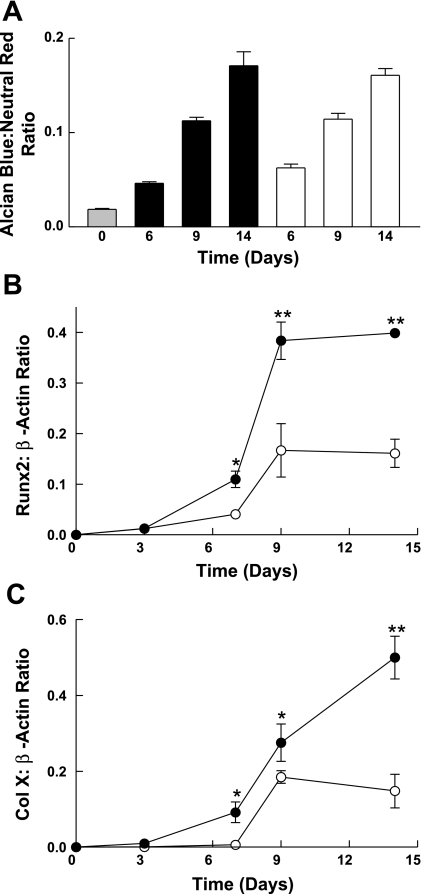
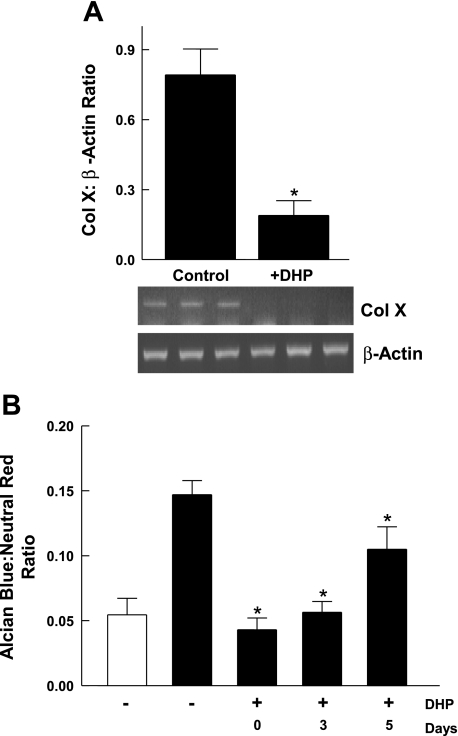
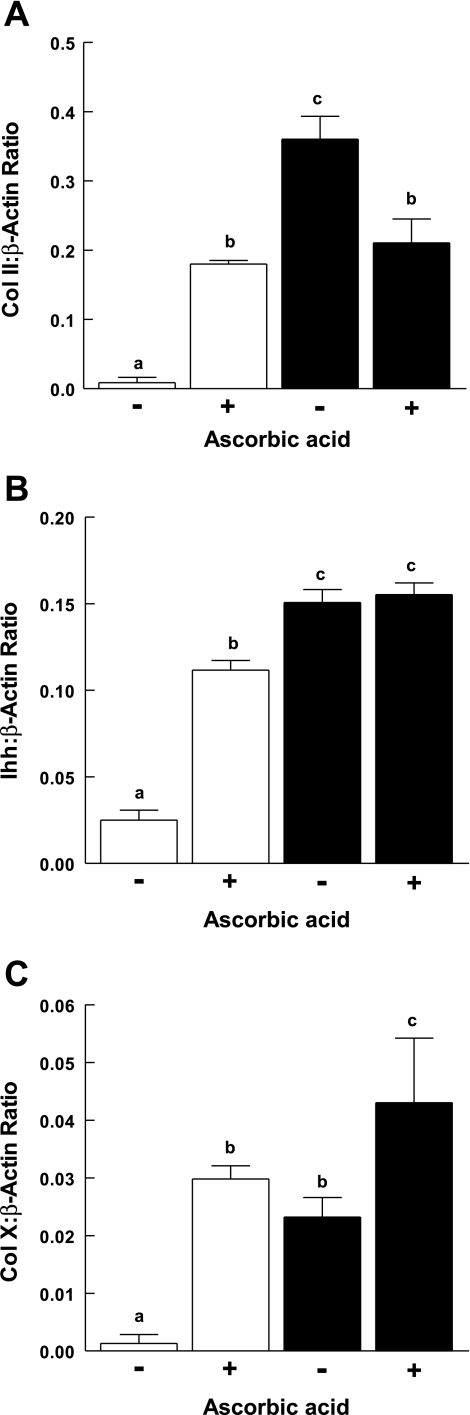
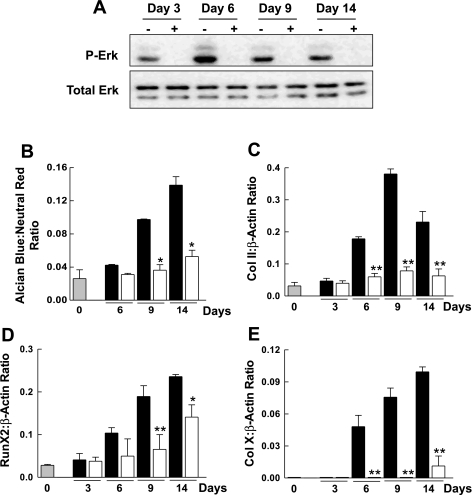
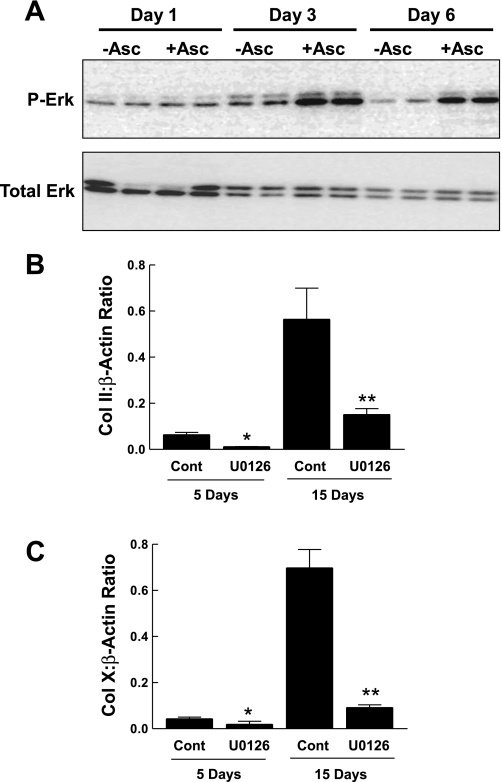
The ATDC5 cell line exhibits a multistep process of chondrogenic differentiation analogous to that observed during endochondral bone formation. Previous investigators have induced ATDC5 cells to differentiate by exposing them to insulin at high concentrations. We have observed spontaneous differentiation of ATDC5 cells maintained in ascorbic acid-containing alpha-MEM. A comparison of the differentiation events in response to high-dose insulin vs. ascorbic acid showed similar expression patterns of key genes, including collagen II, Runx2, Sox9, Indian hedgehog, and collagen X. We took advantage of the action of ascorbic acid to examine signaling events associated with differentiation. In contrast to high-dose insulin, which downregulates both IGF-I and insulin receptors, there were only minimal changes in the abundance of these receptors during ascorbic acid-induced differentiation. Furthermore, ascorbic acid exposure was associated with ERK activation, and ERK inhibition attenuated ascorbic acid-induced differentiation. This was in contrast to the inhibitory effect of ERK activation during IGF-I-induced differentiation. Inhibition of collagen formation with a proline analog markedly attenuated the differentiating effect of ascorbic acid on ATDC5 cells. When plates were conditioned with ATDC5 cells exposed to ascorbic acid, ATDC5 cells were able to differentiate in the absence of ascorbic acid. Our results indicate that matrix formation early in the differentiation process is essential for ascorbic acid-induced ATDC5 differentiation. We conclude that ascorbic acid can promote the differentiation of ATDC5 cells by promoting the formation of collagenous matrix and that matrix formation mediates activation of the ERK signaling pathway, which promotes the differentiation program.


Figures

Fig. 1.
Fig. 1.
ATDC5 cell differentiation in various medium conditions. A: ATDC5 cells were incubated with DMEM-F-12 supplemented with 90 mg/ml calcium, nonessential amino acids, or 50 μg/ml ascorbic acid alone or in combination. Cells were also maintained in standard α-MEM that contains ascorbic acid (Asc-α-MEM). Three markers of differentiation, collagen (Col) II, Runx2, and Col X, and a control gene, β-actin, were assessed using semiquantitative RT-PCR. Triplicate samples were analyzed for each condition. Quantification of these results, calculated as the ratio of Col II (B), Runx2 (C), and Col X (D) to β-actin expression, is shown as means ± 1 SD for triplicate determinations. E: proteoglycan accumulation was assessed using Alcian blue and normalized for cell content using neutral red staining. The dyes were extracted, and absorbance was determined. The ratio of Alcian blue to neutral red was calculated (n = 3 for each condition). Filled bars, DMEM-F-12; open bars, Asc-α-MEM. *P < 0.05 vs. DMEM-F-12 alone; **P < 0.01 vs. DMEM-F-12 alone, as determined by ANOVA. A 2nd replicate experiment gave similar results.
Fig. 2.
Fig. 2.
The effect of ascorbic acid on the induction of differentiation markers in ATDC5 cells. A: ATDC5 cells cultured in DMEM-F-12 were incubated with various concentrations of ascorbic acid (0–100 μg/ml) for 14 days. Proteoglycan accumulation was analyzed by Alcian blue staining and normalized for cell content using neutral red staining. Results, expressed as the ratio of Alcian blue to neutral red, are presented as the mean ± 1 SD for triplicate determinations. *P < 0.01 vs. control, as determined by ANOVA. An additional experiment gave similar results. B: cells were grown in α-MEM or Asc-α-MEM for 10 days. The expression of Col II, Indian hedgehog (Ihh), and Col X was assessed in triplicate samples by semiquantitative RT-PCR. β-Actin was used as an internal control.
Fig. 3.
Fig. 3.
The time course of the effect of ascorbic acid on cell proliferation and chondrogenic-related gene expression. ATDC5 cells were grown to confluence in DMEM-F-12. At confluence (day 0), cells were induced to differentiate for 14 days in the presence of Asc-α-MEM (●) or DMEM-F-12 with 1,600 nM insulin (○). A: On days 0, 1, 2, 4, 7, and 10, cells were counted. Data represent the mean (n = 3 for each condition). A similar experiment was performed in which cells were lysed and RNA was prepared. The expression of Col II, Sox9, Ihh, p21, BMP2, and β-actin was assessed using semiquantitative RT-PCR. The ratio of Col II (B), Sox9 (C), Ihh (D), p21 (E), and bone morphogenetic protein 2 (BMP2; F) to β-actin expression is shown as means ± 1 SD for triplicate analyses. *P < 0.05 vs. the corresponding time point; **P < 0.001 vs. the corresponding time point.
Fig. 4.
Fig. 4.
The effect of ascorbic acid on the induction of markers of chondrocyte hypertrophy. ATDC5 cells were grown to confluence and induced to differentiate as for Fig. 3 (filled bars or ●, Asc-α-MEM; open bars or ○, 1,600 nM insulin in DMEM-F-12) for ≤14 days. A: On days 0, 6, 9, and 14, cells were stained with Alcian blue and neutral red. Dye was extracted and absorbance measured. The ratio of Alcian blue to neutral red is shown as the mean + 1 SD for triplicate analyses. Differences between groups were not significant, as determined by ANOVA. A parallel experiment was done to assess the expression of Runx2 (B) and Col X (C) using semiquantitative RT-PCR. Data are shown as the mean ± 1 SD for triplicate analyses. Additional experiments gave similar results. *P < 0.05; **P < 0.001 vs. corresponding time point by ANOVA.
Fig. 5.
Fig. 5.
The effect of ascorbic acid on insulin and IGF-I receptor content and ERK activation. ATDC5 cells were maintained for the indicated times in Asc-α-MEM or DMEM-F-12 containing 1,600 nM insulin. A: at the times indicated, duplicate cell lysates were prepared and analyzed by Western immunoblotting for the IGF-I receptor-β (IGF-Iβ) subunit and the insulin receptor-β (IRβ) subunit. Samples were also analyzed for total ERK to assess sample loading and transfer. B: a similar experiment was performed in which duplicate samples were prepared from cells maintained in DMEM-F-12 (0) or Asc-α-MEM for a duration of 14 days. At indicated times, these samples were analyzed by Western immunoblotting for the IGF-I receptor β-subunit, insulin receptor β-subunit, phosphorylated ERK (p-ERK), and total ERK.
Fig. 6.
Fig. 6.
The effect of a collagen synthesis inhibitor on ascorbic acid-induced ATDC5 cell differentiation. A: cells were grown to confluence in DMEM-F-12 and then switched to Asc-α-MEM. 3,4-Dehydro-l-proline (DHP; 0.4 mM) or vehicle (control) was added to the medium. Cells were lysed on day 10. Total RNA was extracted and analyzed for the expression of Col X and β-actin using semiquantitative RT-PCR. Data representing the ratio of Col X to β-actin expression are shown as the mean + 1 SD for triplicate samples. *P < 0.001, control vs. DHP by unpaired t-test. A, bottom: Col X and β-actin expression. Triplicate samples were analyzed for each condition. A replicate experiment gave similar results. B: cells were grown to confluence in DMEM-F-12 (open bar) and then switched to Asc-α-MEM (filled bars). DHP (0.4 mM) was added starting on day 0, 3, or 5. Cells were maintained until day 14. At that time, cells were stained for proteoglycan accumulation using Alcian blue and neutral red. The dye was extracted and absorbance determined. Data representing the ratio of Alcian blue to neutral red are shown as the mean + 1 SD for triplicate determinations (n = 3 for each condition). *P < 0.01 vs. Asc-α-MEM/DHP.
Fig. 7.
Fig. 7.
The effect of extracellular matrix produced by ascorbic acid-induced ATDC5 cells on chondrocyte differentiation. Plates were conditioned by culturing ATDC5 cells in α-MEM (open bars) or Asc-α-MEM (filled bars) for 5 days. Cells were removed, and fresh ATDC5 cells were plated and maintained in α-MEM with (+) or without (−) ascorbic acid for 7 days. The expression of Col II (A), Ihh (B), and Col X (C) was determined using RT-PCR. Data normalized to β-actin expression are shown as the mean + 1 SD for triplicate samples. Letters above the bars indicate groups that differ significantly from one another based on ANOVA. An additional experiment gave similar results.
Fig. 8.
Fig. 8.
The effect of the ERK pathway inhibitor U-0126 on chondrocyte hypertrophy. A: ATDC5 cells at confluence were incubated continuously for 14 days with Asc-α-MEM containing either 0.1% DMSO vehicle (−) or 10 μM U-0126 (+). Levels of p-ERK and total ERK were determined by Western blot analysis. B: ATDC5 cells at confluence (gray bar) were switched to Asc-α-MEM in the absence (black bars) or presence (open bars) of U-0126 (10 μM) for ≤14 days. At the times indicated, cells were stained with Alcian blue and neutral red. Data representing the ratio of Alcian blue to neutral red are shown as the mean ± 1 SD for triplicate determinations. CE: a similar experiment was performed in which the expression of Col II (C), Runx2 (D), and Col X (E) was analyzed by semiquantitative RT-PCR. Data represent the ratio of the expression of each gene to β-actin. Gene expression data are shown as the mean + 1 SD for triplicate determinations. *P < 0.01 vs. corresponding control; **P < 0.001 vs. corresponding control. Additional experiments gave similar results.
Fig. 9.
Fig. 9.
The effect of preconditioned plates and ERK signaling. A: preconditioned plates were prepared as in Fig. 7, using α-MEM without (−Asc) or with (+Asc) ascorbic acid. Fresh ATDC5 cells were seeded on the preconditioned plates and cultured for ≤15 days in α-MEM. At the time points indicated, cell lysates were prepared and analyzed for p-ERK and total ERK by Western immunoblotting. B: ATDC5 cells seeded on plates preconditioned by ATDC5 cells grown in the presence of ascorbic acid were maintained in the absence or presence of 10 μM U-0126. At the times indicated, total RNA was prepared and analyzed by RT-PCR for Col II. C: the samples from the experiment in B were analyzed for Col X expression. Data representing the ratio to β-actin expression are shown as the mean + 1 SD of triplicate analyses. *P <0.05 or **P <0.001 vs. corresponding control. An additional experiment gave similar results.

Similar articles

Cited by

References

    1. Adams JC, Watt FM. Regulation of development and differentiation by the extracellular matrix. Development 117: 1183–1198, 1993 - PubMed
    1. Altaf FM, Hering TM, Kazmi NH, Yoo JU, Johnstone B. Ascorbate-enhanced chondrogenesis of ATDC5 cells. Eur Cell Mater 12: 64–69, 2006 - PubMed
    1. Aronow MA, Gerstenfeld LC, Owen TA, Tassinari MS, Stein GS, Lian JB. Factors that promote progressive development of the osteoblast phenotype in cultured fetal rat calvaria cells. J Cell Physiol 143: 213–221, 1990 - PubMed
    1. Atsumi T, Miwa Y, Kimata K, Ikawa Y. A chondrogenic cell line derived from a differentiating culture of AT805 teratocarcinoma cells. Cell Differ Dev 30: 109–116, 1990 - PubMed
    1. Bosnakovski D, Mizuno M, Kim G, Takagi S, Okumura M, Fujinaga T. Chondrogenic differentiation of bovine bone marrow mesenchymal stem cells (MSCs) in different hydrogels: influence of collagen type II extracellular matrix on MSC chondrogenesis. Biotechnol Bioeng 93: 1152–1163, 2006 - PubMed

Publication types

MeSH terms