. 2010 Aug 5;29(31):4473-84.
doi: 10.1038/onc.2010.200. Epub 2010 Jun 7.

The NADPH oxidases NOX4 and DUOX2 regulate cell cycle entry via a p53-dependent pathway

Affiliations

The NADPH oxidases NOX4 and DUOX2 regulate cell cycle entry via a p53-dependent pathway

A Salmeen et al. Oncogene. .

Abstract

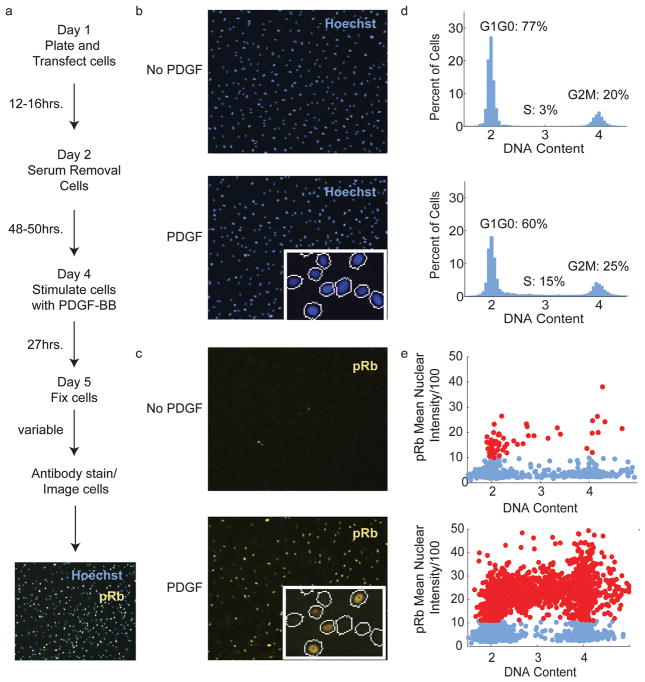
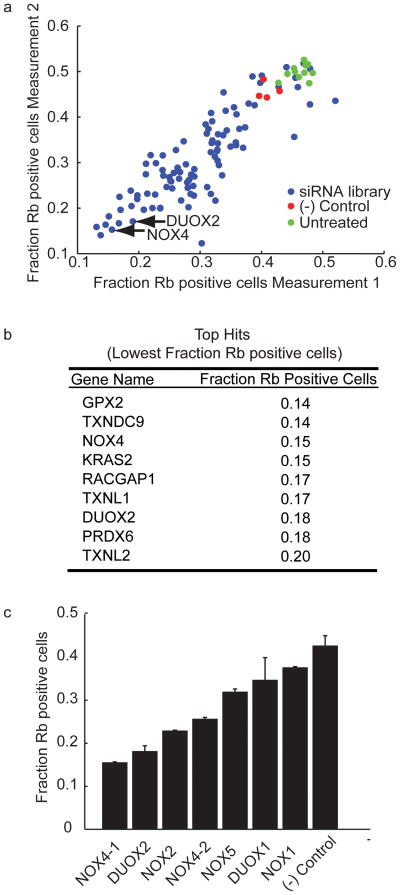
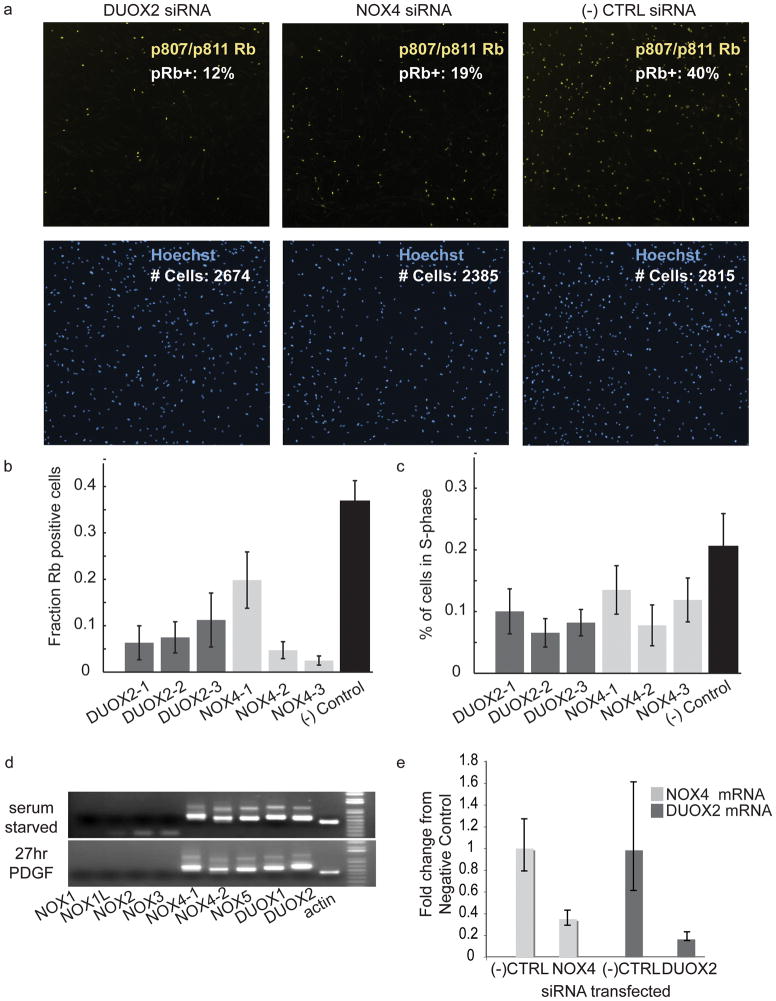
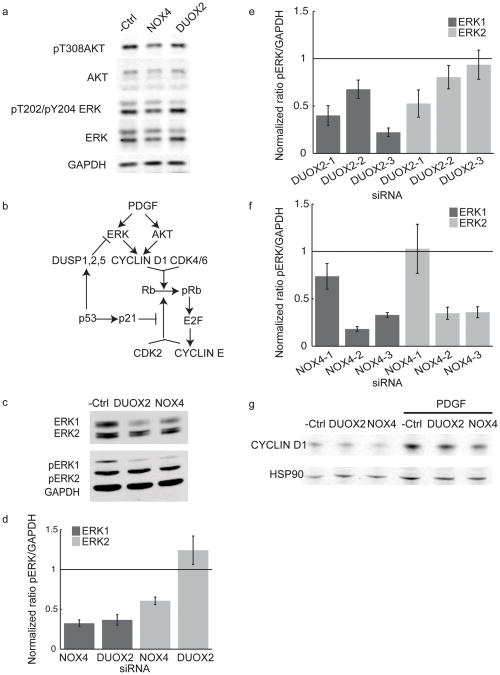
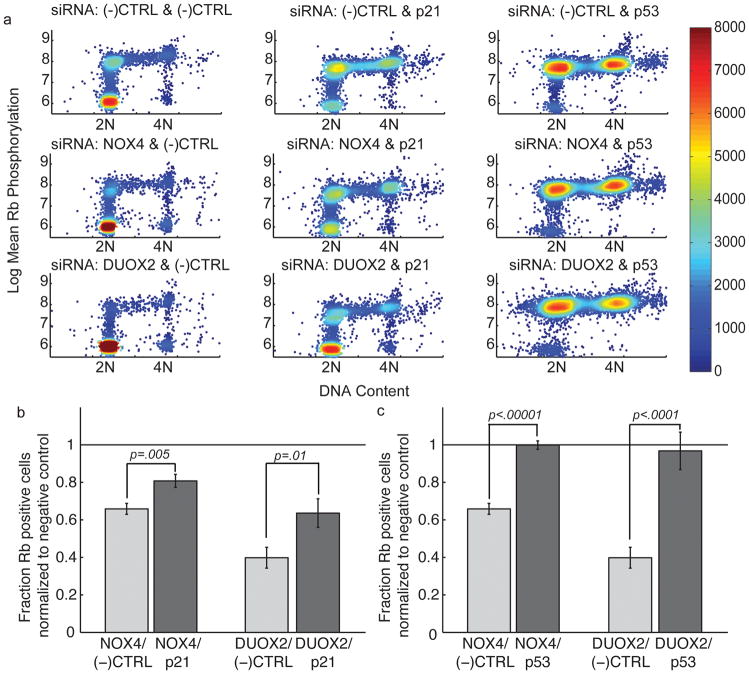
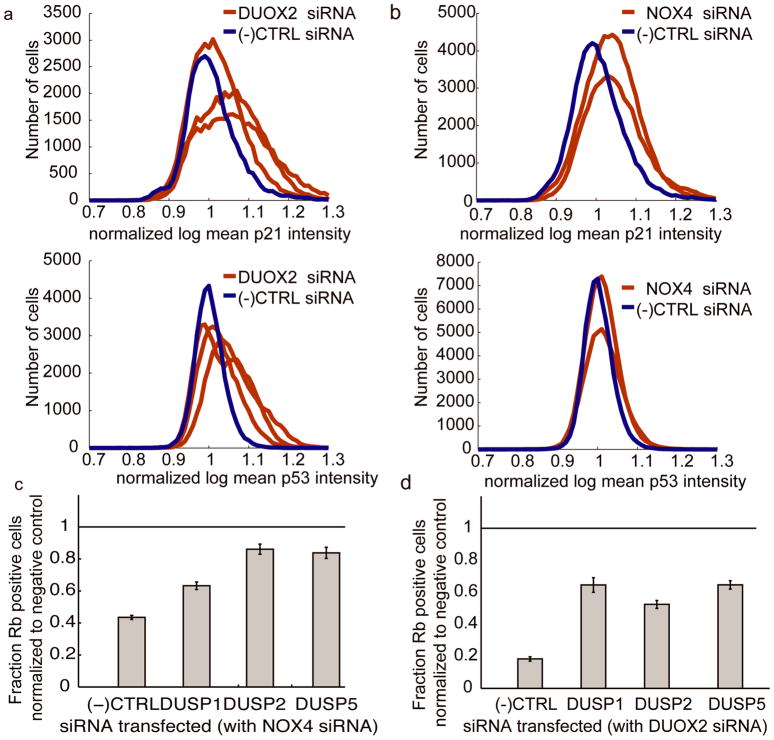
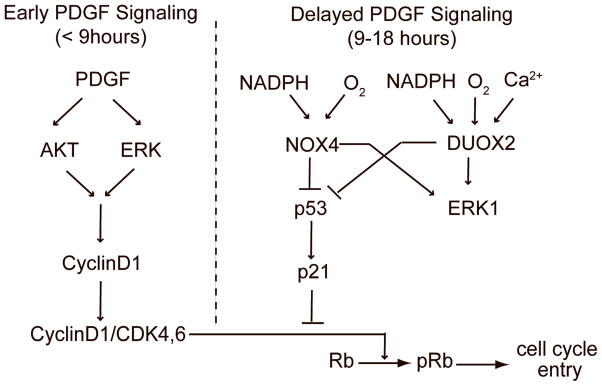
Reactive oxygen species (ROS) are produced in growth factor-signaling pathways leading to cell proliferation, but the mechanisms leading to ROS generation and the targets of ROS signals are not well understood. Using a focused siRNA screen to identify redox-related proteins required for growth factor-induced cell cycle entry, we show that two ROS-generating proteins, the NADPH oxidases NOX4 and DUOX2, are required for platelet-derived growth factor (PDGF) induced retinoblastoma protein (Rb) phosphorylation in normal human fibroblasts. Unexpectedly, NOX4 and DUOX2 knockdown did not inhibit the early signaling pathways leading to cyclin D1 upregulation. However, hours after growth factor stimulation, NOX4 and DUOX2 knockdown reduced ERK1 phosphorylation and increased levels of the tumor suppressor protein p53 and a cell cycle inhibitor protein p21 (Waf1/Cip1) that is transcriptionally regulated by p53. Co-knockdown of NOX4 or DUOX2 with either p53 or with p21 overcame the inhibition of Rb phosphorylation that occurred with NOX4 or DUOX2 knockdown alone. Our results argue that rather than primarily affecting growth factor receptor signaling, NOX4 and DUOX2 regulate cell cycle entry as part of a p53-dependent checkpoint for proliferation.


Conflict of interest statement

Conflict of Interest

The authors declare no conflict of interest.

Figures

Figure 1
Figure 1. Development of cell cycle entry assay
a) Schematic of the cell cycle entry assay. b) Images of Hoechst stained cells that are serum starved (top) and PDGF stimulated (bottom). The lower right hand corner of the image of cells that have been stimulated by PDGF shows a zoomed region of the image with the mask that was used to calculate the Hoechst stain intensities. c) Images of Rb staining for the same cells shown in Figure 1b. The lower right hand corner of the image of cells that have been stimulated by PDGF shows a zoomed region with the mask that was determined form the Hoechst stain and was used to calculate the Rb staining intensities. Cells labeled with a red dot have an Rb staining intensity above the intensity limit that was set using the kmeans algorithm (see Supplementary Information) to consider cells as Rb positive. d) Histograms of the DNA content determined from the images shown in b). e) Scatter plots of the mean intensity of the phosphorylated Rb stain versus DNA content. Cells that fall above the Rb limit determined in the analysis by a kmeans algorithm are shown in red.
Figure 2
Figure 2. siRNA screening results
a) Results from the siRNA screen comparing the duplicate measurements (one on each axis) for each gene and for the controls (GL-3 diced siRNA as the negative control and untransfected cells for comparison). b) List of the genes for which the corresponding siRNA resulted in the lowest Rb staining intensity (the list was arbitrarily cut off to include approximately the lowest 10%). c) Comparison of the fraction of Rb positive cells for six members of the NADPH oxidase family. Due to a separate listing for a NOX4 variant in an earlier version of the NCBI RefSeq database (subsequently removed), we generated two diced siRNA pools for different regions of NOX4 and found that NOX4-1 siRNA. The NOX4-1 diced siRNA pool also caused a more significant reduction in NOX4 mRNA levels when measured by quantitative RT-PCR (Supplementary Figure 3d). The NADPH oxidase NOX3 was excluded because the siRNA preparation was unsuccessful.
Figure 3
Figure 3. Verification that NOX4 and DUOX2 affect Rb phosphorylation in HS68 cells
a) Images of cells transfected with negative control siRNA (10nM), NOX4 Dharmacon synthetic siRNA pool (10nM) and DUOX2 Dharmacon synthetic siRNA pool (10nM) stained with pSer807/pSer811 Rb antibodies (top) and stained with Hoechst stain (bottom). b) Combined results from three independent experiments (n=17 for each NOX4 and DUOX2 and n=13 for negative control) showing the effect of three individual siRNA for NOX4 (NOX4-1: CAGGAGGGCUGCUGAAGUA, NOX4-2: GGGCUAGGAUUGUGUCUAA, NOX4-3: GAUCACAGCCUCUACAUAU) and DUOX2 (DUOX2-1: GGAAUGGCCUCCCAGAUUU, DUOX2-2: GGAGUGAUCUCAACCCUAA and DUOX2-3: GAGGAUAAGUCCCGUCUAA) on the fraction of Rb positive cells. The final concentration of siRNA used was 10 or 20nM. The negative control was Dharmacon siGenome Non-Targeting pool number 2. c) Same as b) except figure shows quantification of fraction of cells in S-phase determined from measurements of the Hoechst stain intensity. d) Nested PCR from cDNA libraries generated from HS68 cells that were serum starved 48 hours (top) or serum starved for 48 hours then stimulated with PDGF for 27 hours (bottom). e) Quantitative RT-PCR from cDNA libraries generated from cells transfected with 20nM Dharmacon synthetic pools of NOX4 or DUOX2 siRNA or Dharmacaon negative control siRNA and serum starved 48 hours. Error bars represent the low and high fold change based on the standard deviation of the ΔΔCt values for three PCR reactions from the same cDNA library with the exception of detection of the DUOX2 transcript with DUOX2 siRNA which was only detectable in two of three PCR reactions.
Figure 4
Figure 4. NOX4 and DUOX2 knockdown suppresses long term ERK1 phosphorylation but not short term ERK1 phosphorylation, Akt phosphorylation or Cyclin D1 expression
a) Western blot showing ERK and Akt phosphorylation in response to PDGF after 30minutes for cells transfected with synthetic pools of NOX4, DUOX2 or non-targeting siRNA from Dharmacon. The complete western blot with molecular weight markers is shown in the supplementary information. b) Diagram of PDGF signaling pathways that were investigated to study the role of NOX4 and DUOX2 in proliferation. c) Western blot showing ERK phosphorylation in lysates from cells transfected with Dharmacon siGENOME synthetic pools of NOX4, DUOX2 or non-targeting siRNA after 9 hours of PDGF stimulation. The complete western blot with molecular weight markers is shown in the supplementary information. The bands were labeled as ERK1 and ERK2 based on their respective molecular weights, the identity of the two bands was also confirmed by transfecting cells with ERK1 and ERK2 specific siRNA. d) Quantification of ERK1 and ERK2 phosphorylation levels expressed as a ratio to levels of GAPDH from cell lysates transfected with synthetic pools of NOX4, DUOX2 or non-targeting siRNA (all Dharmacon siGENOME siRNA) after nine hours of PDGF stimuli. Error bars represent standard error of the mean, n=6. e) Quantification of ERK1 and ERK2 phosphorylation expressed as a ratio to GAPDH levels from cell lysates transfected with single synthetic siRNA targeting DUOX2 or non-targeting siRNA (all Dharmacon siGENOME siRNA) after nine hours of PDGF stimuli. Error bars represent standard error of the mean, n=6. f) Quantification of ERK1 and ERK2 phosphorylation expressed as a ratio to GAPDH levels from cell lysates transfected with single synthetic siRNA targeting NOX4 or non-targeting siRNA (all Dharmacon siGENOME siRNA) after nine hours of PDGF stimuli. Error bars represent standard error of the mean, n=6. g) Western blot showing CyclinD1 expression levels in response to PDGF with NOX4 and DUOX2 siRNA.
Figure 5
Figure 5. Co-knockdown of NOX4 or DUOX2 with p53 or p21 restores cell cycle entry
a) DNA content scatter plots in which the color of the points represents the density of the points in a given region. The density is calculated by the reciprocal of the area of the voronoi region surrounding the centroid of a point. The two siRNA that were transfected are listed at the top of each plot. For all of the co-knockdown experiments the total siRNA concentration was kept constant by adding negative control siRNA to ensure that any effects we observed were not due to concentration differences. b) Results of the cell cycle entry assay for co-knockdown of synthetic pools of NOX4, DUOX2 or non-targeting siRNA (all Dharmacon siGENOME siRNA) with p21 or non-targeting negative control siRNA. The light grey bars were normalized to the fraction of Rb-positive cells in samples transfected with (−)CTRL/(−)CTRL siRNA. The dark grey bars were normalized to the fraction of Rb-positive cells for cells transfected with (−)CTRL/p21 siRNA. P-values were calculated using a t-test assuming a normal distribution. c) Results of the cell cycle entry assay for co-knockdown of synthetic pools of NOX4, DUOX2 or non-targeting siRNA (all Dharmacon siGENOME siRNA) with p53 or non-targeting negative control siRNA. The light grey bars were normalized to the fraction of Rb-positive cells in samples transfected with (−)CTRL/(−)CTRL siRNA. The dark grey bars were normalized to the fraction of Rb-positive cells for cells transfected with (−)CTRL/p53 siRNA.
Figure 6
Figure 6. NOX4 and DUOX2 are required to suppress p53-dependent signaling pathways
a) DUOX2 knockdown increases p21 and p53 levels. Intensity distributions of single cell immunofluorescence measurements of cells stimulated with PDGF for 18 hours and stained with p21 antibodies (top) or p53 antibodies (bottom). Cells were transfected with DUOX2-1, DUOX2-2 DUOX2-3 or negative control synthetic siRNA (N=12, for p21, p< .001 for all three DUOX2 siRNAs and, for p53, p<.05 for DUOX2-1 and DUOX2-2, see supplementary material). b) NOX4 knockdown increases p21 and p53 levels. Panels same as a) except that cells were transfected with NOX4-2, NOX4-3 or negative control siRNAs ( N=18, for p21, p<.001 for NOX4-2 and NOX4-3 siRNAs and, for p53, p<.05 for the same siRNAs). c) Compensation by dual specificity phosphatases. DUSP1, DUSP2 and DUSP5 phosphases were knocked down together with NOX4, showing partial compensation of Rb phosphorylation ( Dharmacon siGENOME siRNAs for NOX4 and dicer generated pools targeting the DUSPs). d) Same as c) except that DUOX2 was targeted instead of NOX4.
Figure 7
Figure 7
Proposed model for the role of NOX4 and DUOX2 in promoting cell cycle entry.

Similar articles

Cited by

References

    1. Bae YS, Kang SW, Seo MS, Baines IC, Tekle E, Chock PB, et al. Epidermal growth factor (EGF)-induced generation of hydrogen peroxide. Role in EGF receptor-mediated tyrosine phosphorylation. The Journal of biological chemistry. 1997;272:217–221. - PubMed
    1. Bae YS, Sung JY, Kim OS, Kim YJ, Hur KC, Kazlauskas A, et al. Platelet-derived growth factor-induced H(2)O(2) production requires the activation of phosphatidylinositol 3-kinase. The Journal of biological chemistry. 2000;275:10527–10531. - PubMed
    1. Burch PM, Heintz NH. Redox regulation of cell-cycle re-entry: cyclin D1 as a primary target for the mitogenic effects of reactive oxygen and nitrogen species. Antioxidants & redox signaling. 2005;7:741–751. - PubMed
    1. Burhans WC, Heintz NH. The cell cycle is a redox cycle: Linking phase-specific targets to cell fate. Free radical biology & medicine 2009 - PubMed
    1. Chambard JC, Lefloch R, Pouyssegur J, Lenormand P. ERK implication in cell cycle regulation. Biochimica et biophysica acta. 2007;1773:1299–1310. - PubMed

Publication types

MeSH terms