. 2010 Jun 8:6:374.
doi: 10.1038/msb.2010.30.

Ecological distribution and population physiology defined by proteomics in a natural microbial community

Affiliations

Ecological distribution and population physiology defined by proteomics in a natural microbial community

Ryan S Mueller et al. Mol Syst Biol. .

Abstract

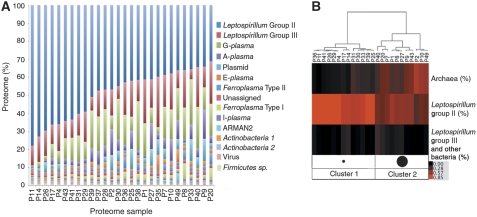
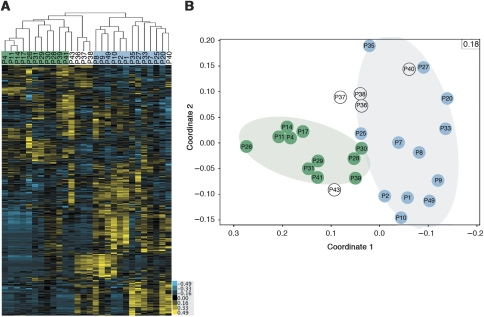
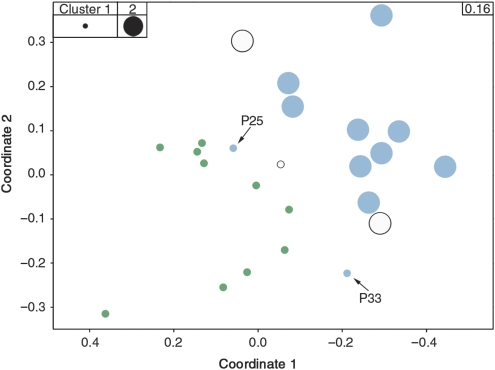
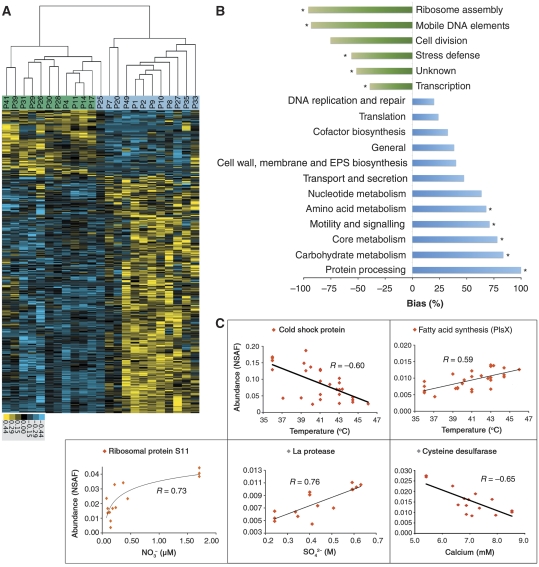
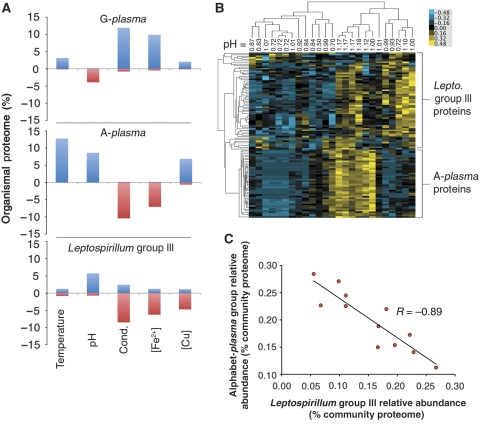
An important challenge in microbial ecology is developing methods that simultaneously examine the physiology of organisms at the molecular level and their ecosystem level interactions in complex natural systems. We integrated extensive proteomic, geochemical, and biological information from 28 microbial communities collected from an acid mine drainage environment and representing a range of biofilm development stages and geochemical conditions to evaluate how the physiologies of the dominant and less abundant organisms change along environmental gradients. The initial colonist dominates across all environments, but its proteome changes between two stable states as communities diversify, implying that interspecies interactions affect this organism's metabolism. Its overall physiology is robust to abiotic environmental factors, but strong correlations exist between these factors and certain subsets of proteins, possibly accounting for its wide environmental distribution. Lower abundance populations are patchier in their distribution, and proteomic data indicate that their environmental niches may be constrained by specific sets of abiotic environmental factors. This research establishes an effective strategy to investigate ecological relationships between microbial physiology and the environment for whole communities in situ.


Conflict of interest statement

The authors declare that they have no conflict of interest.

Figures

Figure 1
Figure 1
Community structure of biofilm samples. (A) Percent composition of each community proteome based on the organismal assignments for each protein identified. X-axis labels represent biofilm community names. (B) Clustering of biofilm communities (column labels) using community structure data collected by FISH. Color scale is based on the percent composition of each community.
Figure 2
Figure 2
Hierarchical and MDS clustering of whole-community proteomes. (A) Clustering of samples using protein abundance data for proteins detected in at least 30% of samples. Column labels represent sample names and are highlighted in green and blue to represent the two groups of samples reproducibly clustered together. Unhighlighted samples showed variability in their clustering patterns. (B) MDS of samples using all protein abundance data. Sample names are given for each point and stress value, which represents the goodness-of-fit, is reported in top-right corner of the graph (values range from 0.00 to 1.00 and lower values indicate better fit). Green and blue groups from (A) (pale oval regions) are discriminated along coordinate 1. Notably, the blue cluster has a wider distribution along the second coordinate (Y-axis) than the green cluster, suggesting a higher degree of variability in the expression pattern of communities in this group. Source data is available for this figure at www.nature.com/msb.
Figure 3
Figure 3
Correlation of the community structure factor with Leptospirillum Group II proteomes. An MDS separating samples using only Leptospirillum Group II protein abundance data is shown. Symbols for each point represent community structure clusters from Figure 1B and blue and green highlights represent expression groups from Figure 2. All biofilms of the protein expression group labeled green in Figure 2 represent low developmental stage biofilms and correspond to cluster 1 of Figure 1B (i.e. all green samples are small circles). All but two communities (P25 and P33, noted by arrows) from the high developmental stage protein expression group labeled blue in Figure 2 are consistent with biofilms from cluster 2 of Figure 1B (i.e. all but two blue samples are large circles). P25 and P33 are classified as the high developmental stage samples because their whole-community proteomes included many proteins from low abundance organisms and their Leptospirillum Group II proteomes fall at cluster edges. Stress value is reported in top-right corner of the graph.
Figure 4
Figure 4
Correlations of proteins of Leptospirillum Group II with environmental factors. (A) Clustering of samples using abundance values of differentially detected proteins (significance analysis of microarrays with a false-discovery rate <0.05) of Leptospirillum Group II (474 proteins, see Supplementary Table S4 for the complete list of proteins). Column labels signify sample names and green and blue highlights represent expression group designation from Figure 2. (B) Functional differences of Leptospirillum Group II between developmental stages. Values represent the bias in total proteins overrepresented in either high or low developmental stages. Positive values (blue bars) signify categories overrepresented in high developmental stage biofilms and negative values (green bars) signify categories overrepresented in low developmental stage biofilms. Asterisks note categories significantly overrepresented (98% confidence interval). (C) Pairwise scatter plots of measurements of selected environmental factors strongly correlated to the abundances of a given protein. Source data is available for this figure at www.nature.com/msb.
Figure 5
Figure 5
Correlations of the proteins of low abundance organisms with geochemical factors. (A) Percent of A-plasma (n=509 proteins), G-plasma (n=639 proteins), and Leptospirillum Group III (n=936 proteins) identified proteomes either positively (positive values) or negatively correlated (negative values) to a various environmental factors (temperature, pH, conductivity, [Fe2+], and [Cu]). (B) Hierarchical clustering of proteins and samples from A-plasma and Leptospirillum Group III with high correlation to pH using protein abundance data. Values reported at the top of each column represent pH measurements recorded for each sample. Unsupervised clustering of proteins (Y-axis tree) resulted in well-defined groups of A-plasma and Leptospirillum Group III proteins. (C) Scatter plot of relative abundances of Leptospirillum Group III proteins versus those of the Alphabet-plasma Group Proteins (i.e. A-, E-, G-, I-plasma) for high developmental stage whole-community proteomes. Source data is available for this figure at www.nature.com/msb.

References

    1. Allen EE, Bartlett DH (2002) Structure and regulation of the omega-3 polyunsaturated fatty acid synthase genes from the deep-sea bacterium Photobacterium profundum strain SS9. Microbiology 148: 1903–1913 - PubMed
    1. Amann RI, Krumholz L, Stahl DA (1990) Fluorescent-oligonucleotide probing of whole cells for determinative, phylogenetic, and environmental-studies in microbiology. J Bacteriol 172: 762–770 - PMC - PubMed
    1. Baeseman J, Smith R, Silverstein J (2006) Denitrification potential in stream sediments impacted by acid mine drainage: effects of pH, various electron donors, and iron. Microb Ecol 51: 232–241 - PubMed
    1. Belnap C (2009) Quantitative Proteomic Comparison of Biofilm versus Planktonic Communities and Biofilm Response to pH Perturbation. Berkeley: University of California
    1. Bond PL, Smriga SP, Banfield JF (2000) Phylogeny of microorganisms populating a thick, subaerial, predominantly lithotrophic biofilm at an extreme acid mine drainage site. Appl Environ Microbiol 66: 3842–3849 - PMC - PubMed

Publication types