. 2010 Jun 8:6:379.
doi: 10.1038/msb.2010.27.

Automated identification of pathways from quantitative genetic interaction data

Affiliations

Automated identification of pathways from quantitative genetic interaction data

Alexis Battle et al. Mol Syst Biol. .

Abstract

High-throughput quantitative genetic interaction (GI) measurements provide detailed information regarding the structure of the underlying biological pathways by reporting on functional dependencies between genes. However, the analytical tools for fully exploiting such information lag behind the ability to collect these data. We present a novel Bayesian learning method that uses quantitative phenotypes of double knockout organisms to automatically reconstruct detailed pathway structures. We applied our method to a recent data set that measures GIs for endoplasmic reticulum (ER) genes, using the unfolded protein response as a quantitative phenotype. The results provided reconstructions of known functional pathways including N-linked glycosylation and ER-associated protein degradation. It also contained novel relationships, such as the placement of SGT2 in the tail-anchored biogenesis pathway, a finding that we experimentally validated. Our approach should be readily applicable to the next generation of quantitative GI data sets, as assays become available for additional phenotypes and eventually higher-level organisms.


Conflict of interest statement

The authors declare that they have no conflict of interest.

Figures

Figure 1
Figure 1
Overview of method. (A) Signature phenotypes for common pairwise relationships. Each pairwise relationship produces a ‘signature’ double knockout phenotype, as compared with observed individual knockout phenotypes (shown by dotted green lines) and the implied ‘typical interaction’ phenotype (dotted red line). (i, ii) Linear pathway configurations produce a double mutant phenotype similar to that of one of the single mutants. (iii) Independent actions result in a double knockout close to the expected (or ‘typical interaction’) phenotype. (iv) Genes acting separately but with related functions often result in aggravating interactions. (v) If the activity of one gene depends partially on the other (one gene also acts through a separate pathway), the double knockout is likely to be alleviating but not as fully as for a linear pathway. (B) Scoring pairwise structures with GI data. Using the double and single mutant measurements from a genetic interaction assay, a score is computed for each possible local graph structure for every pair of genes. For the example genes shown, the double knockout phenotype aΔbΔ is very similar to the single bΔ. Thus, the linear pathway scores highly compared with the other possible pairwise structures. (C) Scoring complete activity pathway networks (APNs). Here, we show an APN over nine genes. Each complete APN is consistent with a set of local pairwise structures. For example, this graph is consistent with a pairwise relationship where MNL1 is upstream of HRD3 in a linear pathway. We evaluate the score of each consistent local relationship based on the corresponding two single and the double mutant reporter levels, and sum the local scores to compute the global score.
Figure 2
Figure 2
Activity pathway network ensemble for ER data. Applied to the data set of Jonikas et al (2009), our method produced an ensemble of 500 sampled APNs, each over 178 genes. Our method samples many full APNs from our probabilistic model, allowing us to estimate confidence over substructures. Using this likelihood-weighted ensemble, we produce confidence estimates for several graph substructures. For visualization, we produce an aggregated network, which highlights high-confidence pathways (see Materials and methods). Four interesting components of the high-confidence aggregated network have been highlighted, corresponding to pathways shown Figure 3—the blue box corresponds to Figure 3A, green to Figure 3B, orange to Figure 3C, and red to Figure 3D.
Figure 3
Figure 3
Reconstructed pathways for ER data. Visualization of reconstructed pathways. In each panel, we display the most likely network configurations for the relevant set of genes, according to our sampled APNs. A ‘collapsed node’ containing multiple gene names indicates a high-confidence linear pathway among the contained genes, but with the specific ordering varying among our samples. (A) SWR complex. APNs integrate data across multiple pairs of genes to discover relationships even if some data points are missing, statistically weak, or contradictory. Despite the unobserved combinations of ARP6, SWC3, and HTZ1, our method uses all available data, including the correlation scores and the observed alleviating interactions with SWC5, and places all four genes together in a linear chain, reflecting the known relationship among the SWR complex (which includes SWC3, SWC5, and ARP6) and the histone variant H2AZ (HTZ1). (B) ERAD pathway. Our reconstructed APNs placed several ERAD genes in common pathways with high confidence; we show the two most likely configurations of these pathways. Eight of these genes (MNL1, YOS9, DER1, USA1, HRD1, HRD3, CUE1, and UBC7) are known to be involved in ERAD function, and their respective placements in the graph are remarkably consistent with known interdependencies. The final gene, YLR104W, has also been suggested to participate in ERAD (Jonikas et al, 2009). (C) N-linked glycosylation pathway. Genes involved in N-linked glycosylation were automatically placed together in a single linear pathway with very high confidence, as shown in the aggregated view (left). The two highest probability detailed pathways (two middle networks) reflect many correct placements. The glucosyltransferase DIE2 is robustly placed such that it is dependent on the other genes. ALG9 and ALG12 are correctly placed earlier, and ALG3 is correctly placed at the start of this pathway with high confidence. OST3 is correctly placed downstream, but OST5 is incorrectly placed, likely because double mutant data with the other ALG genes was not available. For reference, the true ordering of this pathway (Helenius and Aebi, 2004) is shown as inset to the far right. (D) Tail-anchored protein insertion pathway. We show the three most likely configurations of the set. Very high confidence is assigned to the placement (and relative ordering) of MDY2, YOR164c, and SGT2 upstream of GET1, GET2, and GET3. The relative ordering of GET1, GET2, and GET3 is less certain, but they all occur in this linear pathway with probability 0.98 (leftmost network). SGT2 is a poorly characterized gene not previously associated with tail-anchored protein insertion.
Figure 4
Figure 4
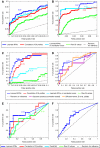
Quantitative evaluation of learned APNs. For each ROC curve shown, the graph is annotated with the computed area under the curve (AUC). (A) Prediction of GO co-function. We evaluated the prediction of gene pairs, which share GO functional annotation. We compared prediction based on (1) the probability of placement of each gene pair in a shared pathway in the learned APNs, (2) Pearson correlation of GI profiles, (3) raw GI scores, and (4) placement in APNs learned without utilization of correlation scores. We restricted AUC computations to the false-positive range shown, obtaining normalized areas 0.202, 0.173, 0.117, and 0.182, respectively. (B) Prediction of KEGG pathway membership. We evaluated the prediction of gene pairs, which participate together in some KEGG canonical pathway. We compared prediction based on (1) the probability of placement of each gene pair in a shared pathway in the learned APNs, (2) Pearson correlation of GI profiles, (3) raw GI scores, and (4) placement in APNs learned without utilization of correlation scores. We restricted area under the curve (AUC) computations to the false-positive range shown, obtaining 0.572, 0.494, 0.292, and 0.529, respectively. (C) Prediction of similar chemical sensitivity phenotypes. On the basis of the data set of Hillenmeyer et al (2008, we selected pairs of genes with highly similar chemical phenotypes. We compared the ability of four methods to predict membership in this test set—probability of placement in a shared pathway in the learned APNs, Pearson correlation from GI profiles, raw GI scores, and placement in APNs learned without correlation scoring. The normalized AUCs for the displayed range were 0.792 (APN), 0.725 (correlation), 0.118 (GI), and 0.371 (APN without correlation). (D) Prediction of unknown genetic interactions. For a set of measurements unavailable at the time of APN learning, we compared methods for predicting unseen alleviating interactions. We compare ROC curves for predictions made from (1) learned APNs, where we score each pair of nodes according to the probability of placement in a shared pathway according to the APNs; (2) predicted GI values from Gaussian Process regression (Williams and Rasmussen, 1996), a baseline method that uses the correlation of observed GI profiles; and (3) predicted interactions based on the diffusion kernel method (Qi et al, 2008). The resulting AUCs were 0.77, 0.67, and 0.71, respectively. (E) Prediction of N-linked glycosylation pathway edges. We evaluated the prediction of edges in the N-linked glycosylation pathway (Helenius and Aebi, 2004). We compared prediction based on (1) the probability of an edge between each gene pair in the learned APNs, (2) Pearson correlation of GI profiles, (3) raw GI scores, and (4) GenePath predictions (Zupan et al, 2003). We obtained AUCs of 0.7314, 0.6399, 0.5603, and 0.5919, respectively. (F) Prediction of KEGG pathway ordering. We evaluated the ability of our networks to predict ordering within KEGG pathways, and obtained an AUC of 0.6480. Our results are significant with P=0.0218.
Figure 5
Figure 5
GFP-Sed5p localization defect in sgt2Δ. (A) Microscopy. GFP-Sed5p localization in WT, sgt2Δ, mdy2Δ, and get3Δ strains demonstrating a defect in GFP-Sed5p localization in sgt2Δ. These results support the placement of SGT2 in the tail-anchored protein biogenesis pathway shown in Figure 3D. (B) Quantitative analysis. The images of at least 30 cells per strain with similar average fluorescence were quantified to determine the distribution of each strain's total fluorescence across pixels of different intensities. The distribution of fluorescence in the sgt2Δ strain differs from that of the wild-type strain with P<1e−13, and is similar to the distribution for the knockout strains of other genes known to be involved in this pathway.

Similar articles

Cited by

References

    1. Ashburner M, Ball CA, Blake JA, Botstein D, Butler H, Cherry JM, Davis AP, Dolinski K, Dwight SS, Eppig JT, Harris MA, Hill DP, Issel-Tarver L, Kasarskis A, Lewis S, Matese JC, Richardson JE, Ringwald M, Rubin GM, Sherlock G (2000) Gene ontology: tool for the unification of biology. The Gene Ontology Consortium. Nat Genet 25: 25–29 - PMC - PubMed
    1. Avery L, Wasserman S (1992) Ordering gene function: the interpretation of epistasis in regulatory hierarchies. Trends Genet 8: 312–316 - PMC - PubMed
    1. Berns K, Hijmans EM, Mullenders J, Brummelkamp TR, Velds A, Heimerikx M, Kerkhoven RM, Madiredjo M, Nijkamp W, Weigelt B, Agami R, Ge W, Cavet G, Linsley PS, Beijersbergen RL, Bernards R (2004) A large-scale RNAi screen in human cells identifies new components of the p53 pathway. Nature 428: 431–437 - PubMed
    1. Beyer A, Workman C, Hollunder J, Radke D, Möller U, Wilhelm T, Ideker T (2006) Integrated assessment and prediction of transcription factor binding. PLoS Comput Biol 2: e70. - PMC - PubMed
    1. Brachmann C, Davies A, Cost G, Caputo E, Li J, Hieter P, Boeke J (1998) Designer deletion strains derived from Saccharomyces cerevisiae S288C: a useful set of strains and plasmids for PCR-mediated gene disruption and other applications. Yeast 14: 115–132 - PubMed

Publication types

MeSH terms

Substances