. 2010 May 28;5(5):e10903.
doi: 10.1371/journal.pone.0010903.

Genome wide analysis of inbred mouse lines identifies a locus containing Ppar-gamma as contributing to enhanced malaria survival

Affiliations

Genome wide analysis of inbred mouse lines identifies a locus containing Ppar-gamma as contributing to enhanced malaria survival

Selina E R Bopp et al. PLoS One. .

Abstract

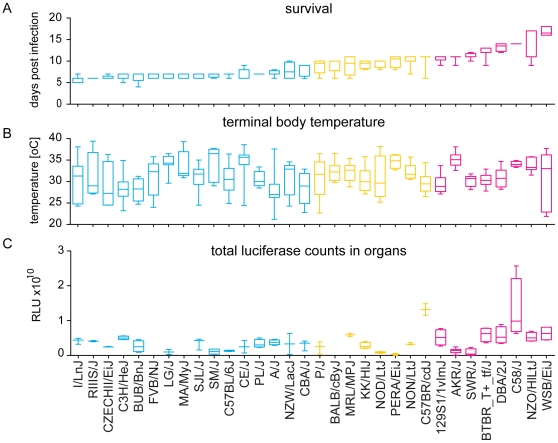
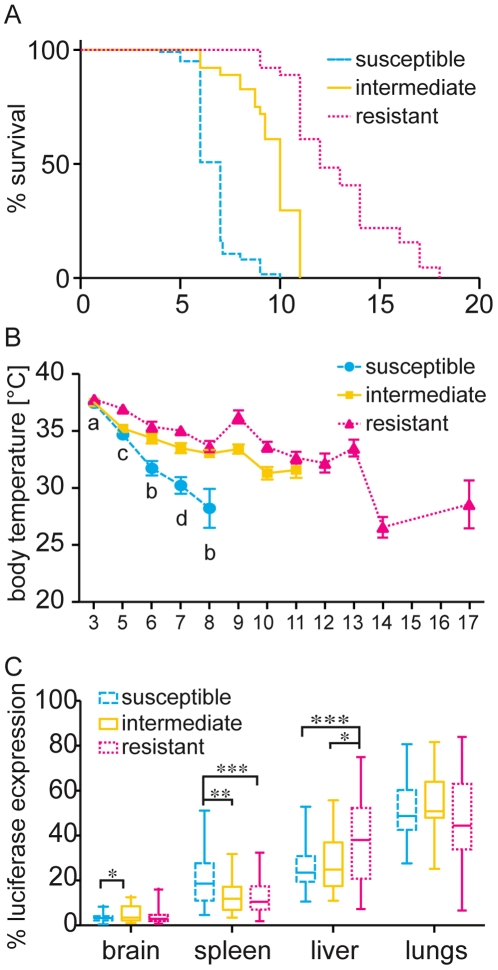
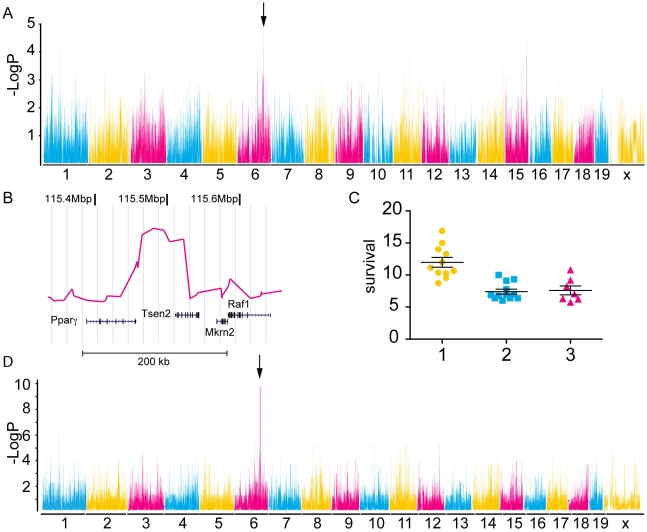
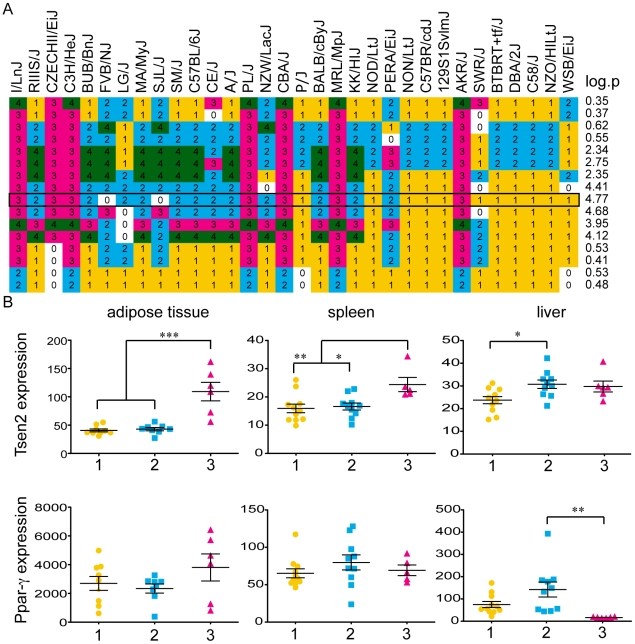
The genetic background of a patient determines in part if a person develops a mild form of malaria and recovers, or develops a severe form and dies. We have used a mouse model to detect genes involved in the resistance or susceptibility to Plasmodium berghei malaria infection. To this end we first characterized 32 different mouse strains infected with P. berghei and identified survival as the best trait to discriminate between the strains. We found a locus on chromosome 6 by linking the survival phenotypes of the mouse strains to their genetic variations using genome wide analyses such as haplotype associated mapping and the efficient mixed-model for association. This new locus involved in malaria resistance contains only two genes and confirms the importance of Ppar-gamma in malaria infection.


Conflict of interest statement

Competing Interests: The authors have declared that no competing interests exist.

Figures

Figure 1
Figure 1. Summary of terminal disease phenotypes for P. berghei ANKA infection.
Four males and four females from 32 different mouse strains were infected with P. berghei and survival (A) terminal body temperature (B) and total luciferase counts from dissected organs (C) were compared. Phenotypes are presented as box and whiskers plots with whiskers showing min to max. The name of the strain is given on the x-axis and the strains are listed for increasing average survival. The number of mice analyzed for each strain and the statistical relationship between different strains are shown in Table S1. The strains were grouped into three clusters according to their survival phenotype: susceptible (blue), intermediate (yellow) and resistant (red).
Figure 2
Figure 2. Differences between the susceptible, intermediate and resistant cluster.
Survival and body temperature were recorded for mice infected with P. berghei. Mice were grouped into susceptible (blue dashed line, infected N = 122, dissected organs N = 42), intermediate (yellow solid line, infected N = 64, dissected N = 23) or resistant (red dotted line, infected N = 64, dissected N = 35) clusters according to their survival phenotype. A) Survival curve for the three clusters. Clusters were significantly different by a Log rank (Mantel Cox) test with p<0.0001. Average and STE for body temperature (B) over the course of infection with x-axis indicating time post infection. Statistical differences by one-way ANOVA followed by Tukey's posttest between clusters: a: susceptible versus resistant, b: susceptible versus resistant and intermediate, c: resistant versus susceptible and intermediate, and d: all three clusters differ. Luciferase expression of parasites in non-perfused organs was measured after dissection of organs from moribund mice. The luciferase expression per organ was expressed as the percentage of the total luciferase expression of all organs. C) Box and whisker plot with whiskers showing min to max relative luciferase expression for each organ. * indicates statistical significance of p<0.05 by one-way ANOVA analyses followed by Tukey's post test, ** indicates p between 0.01 and 0.001, *** p≤0.001.
Figure 3
Figure 3. Genome wide analyses of average survival from 32 mouse strains.
A) A genome wide scan with the haplotype associated mapping (HAM) algorithm using survival as trait of mice from 32 different mouse strains infected with P. berghei identified a locus with -Log10P score of 4.77 on chromosome 6 (arrow). The chromosomes numbers are indicated on the x-axis and -Log10P scores on the y-axis. B) Magnification of the locus on chromosome 6 identified by HAM analysis shows the –Log10P scores (red line) and the underlying genes and their chromosome positions. Three different haplotypes consisting of a combination of three SNPs were detected at the locus with the maximal –Log10P value of 4.77 (See also Figure 4a). The average survival of each strain carrying haplotype 1, 2 or 3 (yellow, blue and pink, respectively) are indicated in C). The efficient mixed-model for association (EMMA) method confirmed the locus on chromosome 6 identified with the HAM analysis (D). The –Log10P score of 9.87 with a false discovery rate of q = 3.5×10⁻⁵ is genome wide significant.
Figure 4
Figure 4. Haplotype distribution at berr6 locus and expression analysis of Ppar-γ and Tsen2 haplotypes.
The HAM analysis is based on the formation of haplotypes consisting of three consecutive SNPs. The compositions of haplotypes at different positions at the berr6 locus are indicated for each mouse strain (A). Each haplotype is indicated by a number and labeled in a different color. The mouse strains are listed according to their survival. –Log10P values for each position are indicated and the haplotypes with the highest score are framed. B) Expression patterns of Tsen2 (upper panel) and Ppar-γ (lower panel) from different mouse strains were compared in adipose tissue, spleen and liver. The relative expression levels (y-axis) for each mouse strain were grouped and colored according to their haplotype at the locus with the highest –Log10P value (A). Significantly different expression levels were detected in all tissues for Tsen2 but only in the liver for Ppar-γ. Scatter dot plots with the mean and the standard error for the expression of Tsen2 and Ppar-γ haplotypes. * indicates statistical significance of p<0.05 by one-way ANOVA analyses followed by Tukey's post test, ** indicates p between 0.01 and 0.001, *** p≤0.001.

Similar articles

Cited by

References

    1. McGuire W, Hill AV, Allsopp CE, Greenwood BM, Kwiatkowski D. Variation in the TNF-alpha promoter region associated with susceptibility to cerebral malaria. Nature. 1994;371:508–510. - PubMed
    1. Allison AC. Protection afforded by sickle-cell trait against subtertian malareal infection. Br Med J. 1954;1:290–294. - PMC - PubMed
    1. Flint J, Hill AV, Bowden DK, Oppenheimer SJ, Sill PR, et al. High frequencies of alpha-thalassaemia are the result of natural selection by malaria. Nature. 1986;321:744–750. - PubMed
    1. Ruwende C, Khoo SC, Snow RW, Yates SN, Kwiatkowski D, et al. Natural selection of hemi- and heterozygotes for G6PD deficiency in Africa by resistance to severe malaria. Nature. 1995;376:246–249. - PubMed
    1. Frodsham AJ, Hill AVS. Genetics of infectious diseases. Hum Mol Genet. 2004;13:R187–194. - PubMed

Publication types