

Deletion of inducible nitric-oxide synthase in leptin-deficient mice improves brown adipose tissue function
- PMID: 20532036
- PMCID: PMC2881035
- DOI: 10.1371/journal.pone.0010962
Deletion of inducible nitric-oxide synthase in leptin-deficient mice improves brown adipose tissue function
Abstract
Background: Leptin and nitric oxide (NO) on their own participate in the control of non-shivering thermogenesis. However, the functional interplay between both factors in this process has not been explored so far. Therefore, the aim of the present study was to analyze the impact of the absence of the inducible NO synthase (iNOS) gene in the regulation of energy balance in ob/ob mice.
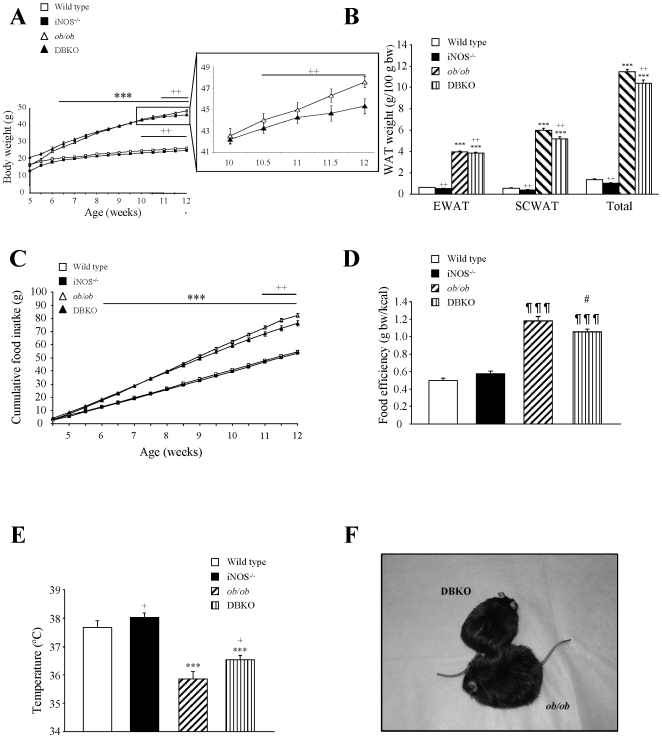
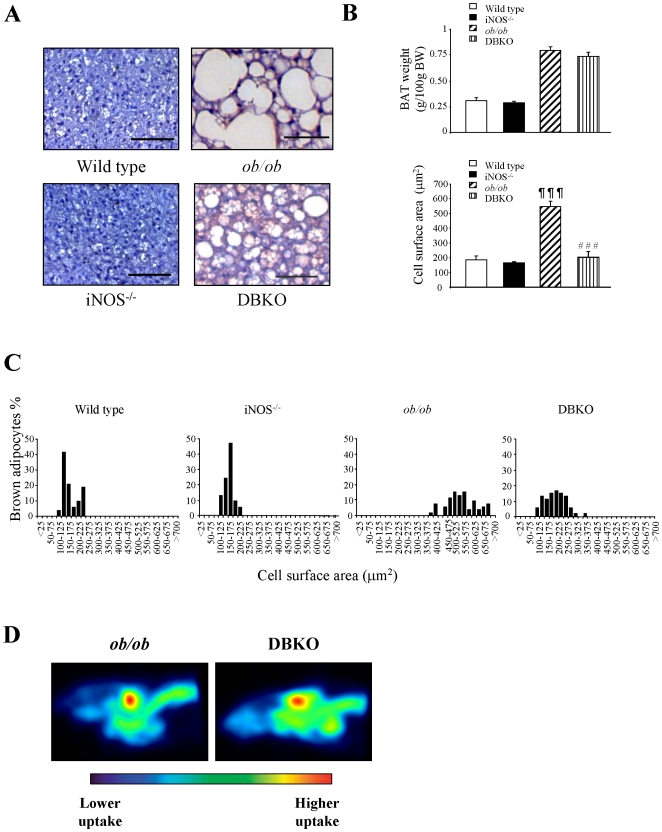
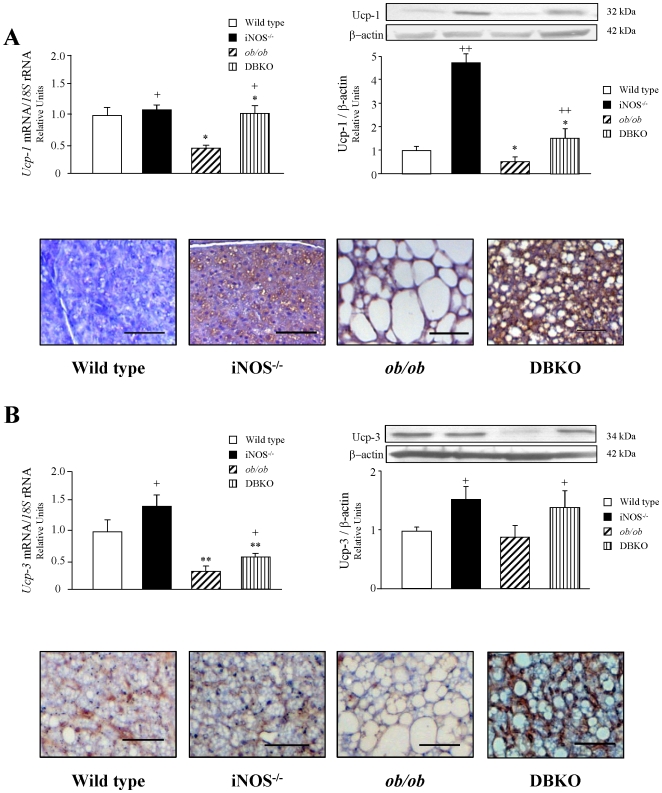
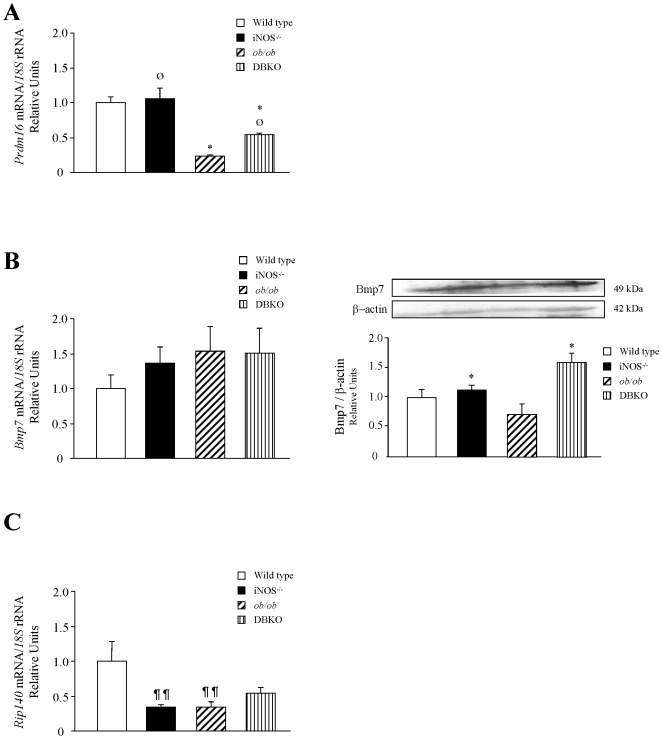
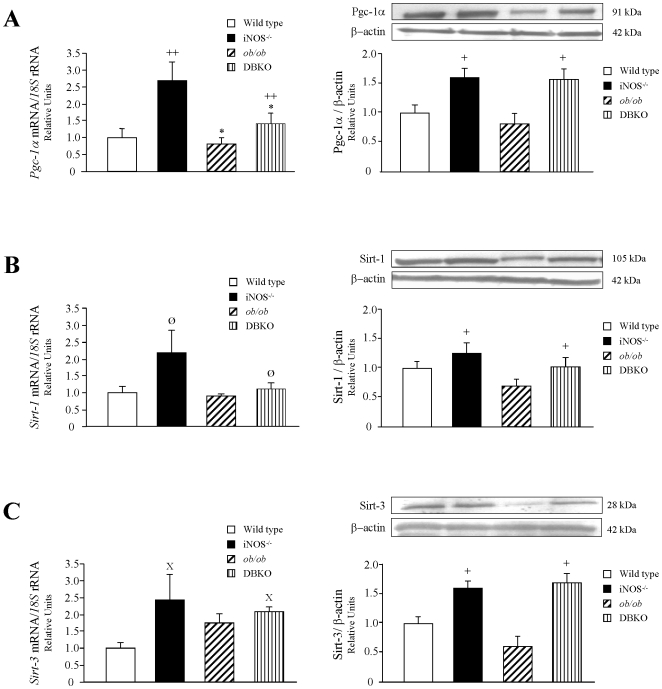
Methods and findings: Double knockout (DBKO) mice simultaneously lacking the ob and iNOS genes were generated, and the expression of molecules involved in the control of brown fat cell function was analyzed by real-time PCR, western-blot and immunohistochemistry. Twelve week-old DBKO mice exhibited reduced body weight (p<0.05), decreased amounts of total fat pads (p<0.05), lower food efficiency rates (p<0.05) and higher rectal temperature (p<0.05) than ob/ob mice. Ablation of iNOS also improved the carbohydrate and lipid metabolism of ob/ob mice. DBKO showed a marked reduction in the size of brown adipocytes compared to ob/ob mutants. In this sense, in comparison to ob/ob mice, DBKO rodents showed an increase in the expression of PR domain containing 16 (Prdm16), a transcriptional regulator of brown adipogenesis. Moreover, iNOS deletion enhanced the expression of mitochondria-related proteins, such as peroxisome proliferator-activated receptor gamma coactivator-1 alpha (Pgc-1alpha), sirtuin-1 (Sirt-1) and sirtuin-3 (Sirt-3). Accordingly, mitochondrial uncoupling proteins 1 and 3 (Ucp-1 and Ucp-3) were upregulated in brown adipose tissue (BAT) of DBKO mice as compared to ob/ob rodents.
Conclusion: Ablation of iNOS improved the energy balance of ob/ob mice by decreasing food efficiency through an increase in thermogenesis. These effects may be mediated, in part, through the recovery of the BAT phenotype and brown fat cell function improvement.
Conflict of interest statement
Figures
Similar articles
-
Transcriptional analysis of brown adipose tissue in leptin-deficient mice lacking inducible nitric oxide synthase: evidence of the role of Med1 in energy balance.Physiol Genomics. 2012 Jul 3;44(13):678-88. doi: 10.1152/physiolgenomics.00039.2012. Epub 2012 May 8. Physiol Genomics. 2012. PMID: 22570438
-
Targeted disruption of the iNOS gene improves adipose tissue inflammation and fibrosis in leptin-deficient ob/ob mice: role of tenascin C.Int J Obes (Lond). 2018 Aug;42(8):1458-1470. doi: 10.1038/s41366-018-0005-5. Epub 2018 Feb 15. Int J Obes (Lond). 2018. PMID: 29449623
-
Protein kinase Cβ deficiency attenuates obesity syndrome of ob/ob mice by promoting white adipose tissue remodeling.J Lipid Res. 2012 Mar;53(3):368-378. doi: 10.1194/jlr.M019687. Epub 2011 Dec 30. J Lipid Res. 2012. PMID: 22210924 Free PMC article.
-
Origins and early development of the concept that brown adipose tissue thermogenesis is linked to energy balance and obesity.Biochimie. 2017 Mar;134:62-70. doi: 10.1016/j.biochi.2016.09.007. Epub 2016 Sep 10. Biochimie. 2017. PMID: 27621146 Review.
-
Effect of high fat diets on energy balance and thermogenesis in brown adipose tissue of lean and genetically obese ob/ob mice.J Nutr. 1987 Dec;117(12):2147-53. doi: 10.1093/jn/117.12.2147. J Nutr. 1987. PMID: 3320290 Review.
Cited by
-
ADH5-mediated NO bioactivity maintains metabolic homeostasis in brown adipose tissue.Cell Rep. 2021 Nov 16;37(7):110003. doi: 10.1016/j.celrep.2021.110003. Cell Rep. 2021. PMID: 34788615 Free PMC article.
-
Altered glucose and lipid homeostasis in liver and adipose tissue pre-dispose inducible NOS knockout mice to insulin resistance.Sci Rep. 2017 Jan 20;7:41009. doi: 10.1038/srep41009. Sci Rep. 2017. PMID: 28106120 Free PMC article.
-
The Impact of the Adipose Organ Plasticity on Inflammation and Cancer Progression.Cells. 2019 Jun 30;8(7):662. doi: 10.3390/cells8070662. Cells. 2019. PMID: 31262098 Free PMC article. Review.
-
Brown Fat and Nutrition: Implications for Nutritional Interventions.Nutrients. 2023 Sep 20;15(18):4072. doi: 10.3390/nu15184072. Nutrients. 2023. PMID: 37764855 Free PMC article. Review.
-
Sleeve Gastrectomy Reduces Body Weight and Improves Metabolic Profile also in Obesity-Prone Rats.Obes Surg. 2016 Jul;26(7):1537-48. doi: 10.1007/s11695-015-1915-0. Obes Surg. 2016. PMID: 26433590
References
-
- Webber J. Energy balance in obesity. Proc Nutr Soc. 2003;62:539–543. - PubMed
-
- Frühbeck G. Does a NEAT difference in energy expenditure lead to obesity? Lancet. 2005;366:615–616. - PubMed
-
- Cannon B, Nedergaard J. Brown adipose tissue: function and physiological significance. Physiol Rev. 2004;84:277–359. - PubMed
-
- Virtanen KA, Lidell ME, Orava J, Heglind M, Westergren R, et al. Functional brown adipose tissue in healthy adults. N Engl J Med. 2009;360:1518–1525. - PubMed
Publication types
MeSH terms
Substances
LinkOut - more resources
Full Text Sources
Molecular Biology Databases
Research Materials
Miscellaneous
