. 2010 Jun 4;5(6):e10966.
doi: 10.1371/journal.pone.0010966.

Hypoxia activates the K-ras proto-oncogene to stimulate angiogenesis and inhibit apoptosis in colon cancer cells

Affiliations

Hypoxia activates the K-ras proto-oncogene to stimulate angiogenesis and inhibit apoptosis in colon cancer cells

Min Zeng et al. PLoS One. .

Abstract

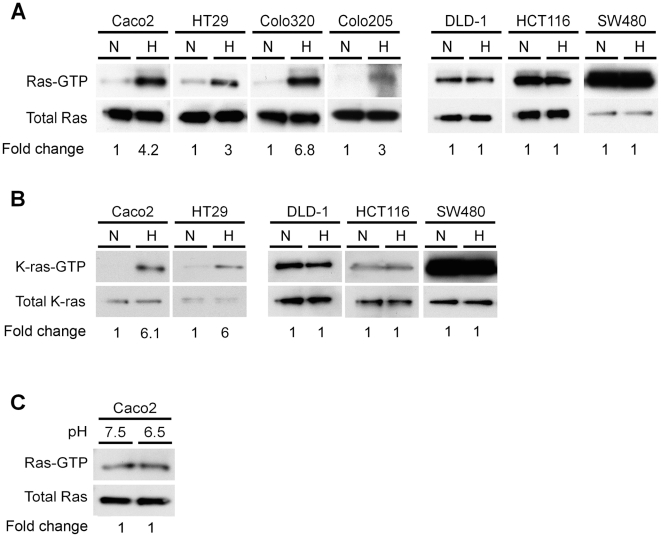
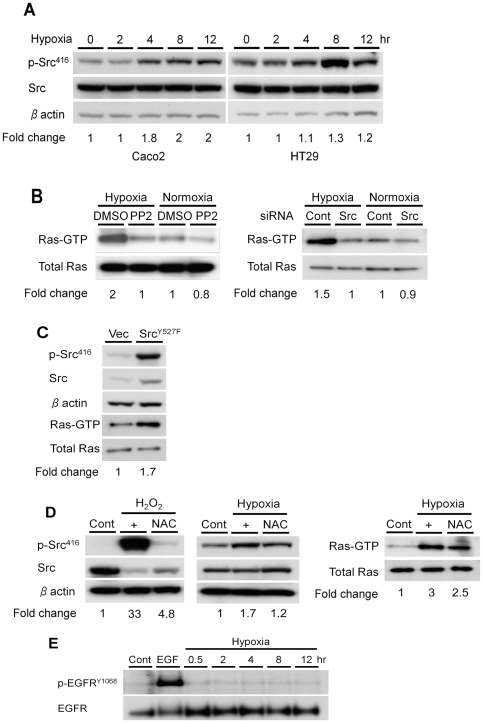
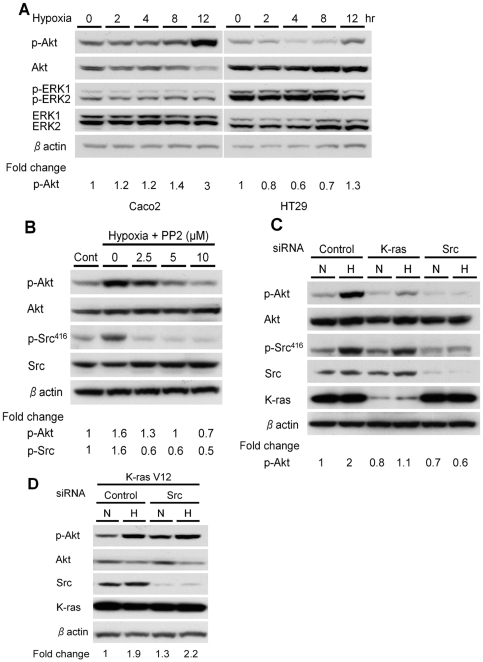
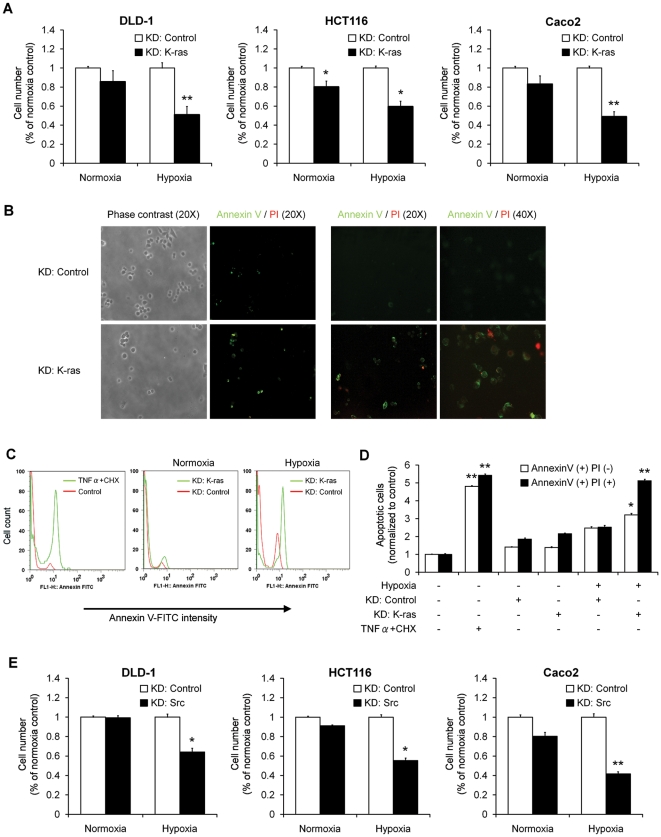
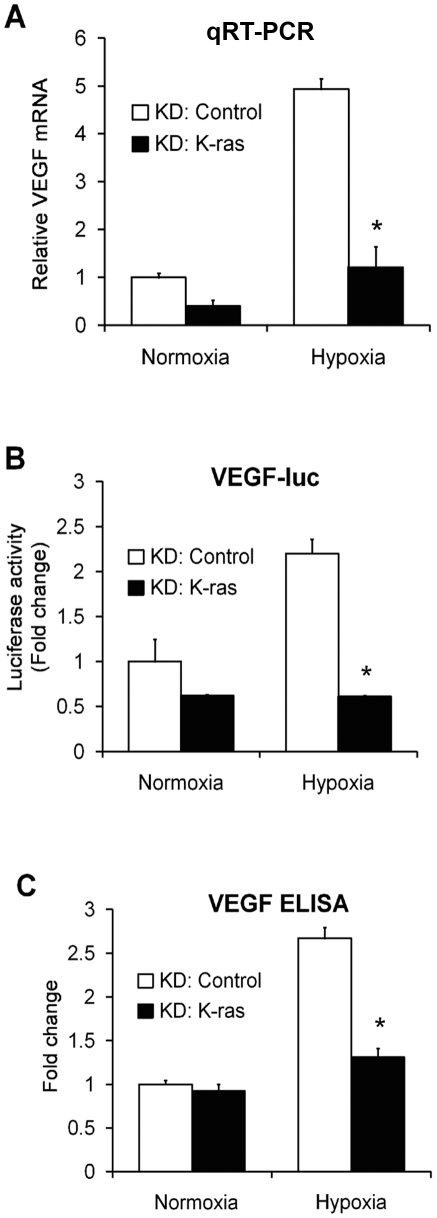
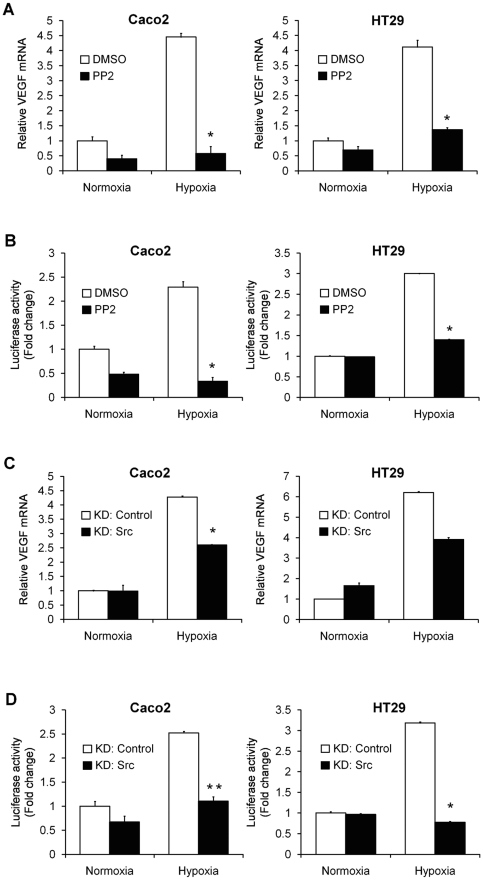
The KRAS proto-oncogene plays a key role in the development of many human tumors and is commonly activated by somatic mutation or signaling through specific growth factor receptors. However, the interaction between the micro-environment and K-ras activity has not been defined. Hypoxia invariably develops as tumors outgrow their supply of oxygen. A series of well-orchestrated cellular adaptations occur that stimulate angiogenesis and enhance survival of the tumor in hypoxic conditions. Our previous studies demonstrated that mutant KRAS alleles can interact with hypoxia to induce vascular endothelial growth factor (VEGF) in colon cancer. We sought to determine whether similar hypoxic responses are also present in tumors without a KRAS mutation. Hypoxia consistently increased the levels of activated, GTP-bound K-ras in colon cancer cell lines with a wild-type KRAS gene, and this depended upon the activation of c-Src. Inhibition of c-Src by PP2 treatment or siRNA knockdown blocked the hypoxic activation of K-ras. This activation of K-ras did not depend upon EGFR and resulted in the phosphorylation of Akt and induction of VEGF expression. In addition, activation of K-ras significantly blocked apoptosis in hypoxic conditions. These studies reveal a unique adaptive mechanism in hypoxia that activates K-ras signaling in the absence of a mutant KRAS oncogene.


Conflict of interest statement

Competing Interests: The authors have declared that no competing interests exist.

Figures

Figure 1
Figure 1. Hypoxia activates Ras in colon cancer cell lines with a wild-type KRAS.
The levels of GTP-bound Ras (A) and GTP-bound K-ras (B) were evaluated in wild-type (left panel) and mutant (right panel) KRAS cell lines grown either in normoxic (N) or hypoxic (H) conditions for 4 hours. Two milligrams of cell extracts were used for a Ras activation assay, followed by Western blotting with the indicated antibodies. Densitometry values are expressed as fold change compared with control values normalized to 1. C, Caco2 cells were cultured in DMEM with pH adjusted to 7.5 or 6.5 for 4 hours. Cell lysates were used for a Ras activation assay followed by Western blotting with a Ras-GTP specific antibody. Densitometry values are expressed as fold change compared with control values normalized to 1.
Figure 2
Figure 2. Activation of Ras by hypoxia is dependent on c-Src activation.
A, Caco2 and HT29 cells were incubated in hypoxic conditions for the indicated times, and Western blotting for phospho-Src416 and total Src was performed. β-actin confirmed equal loading. Densitometry values are expressed as fold change compared with control values normalized to 1. B, Caco2 cells were pretreated with the Src inhibitor PP2 (20 µM) or DMSO for 1 hour (left panel), or transiently transfected with c-Src specific siRNA constructs or a non targeting control (right panel), before incubation in hypoxic or normoxic conditions for 4 hours. Activated Ras was pulled down and SDS-PAGE was performed using a Ras-GTP specific antibody. Total Ras confirmed equal loading. Densitometry values are expressed as fold change compared with control values normalized to 1. C, Lysates of Caco2pEVX and Caco2SrcY527F cells were immunostained for p-Src416 and total Src and also used for a Ras activation assay. Densitometry values for Ras-GTP are expressed as fold change compared with control values normalized to 1. D, left panel, Control cells and cells pretreated with NAC (20 mM) for 20 minutes were exposed for 10 minutes to H2O2 (5 mM). Lysates were then immunoblotted for p-Src416 and total Src. β-actin confirmed equal loading. Middle and right panels, Control Caco2 cells and cells pretreated with NAC (20 mM) for 1 hour were incubated in hypoxia for 4 hours. Western blotting for phospho-Src416 (middle panel) and a Ras activating assay (right panel) were then performed. Densitometry values are expressed as fold change compared with control values normalized to 1. E, Lysates of control Caco2 cells and cells incubated in hypoxia for the indicated times were subjected to Western blotting to detect p-EGFR (Tyr1068) and total EGFR protein levels. Treatment with EGF (100 ng/mL) served as a positive control.
Figure 3
Figure 3. Activation of Akt by hypoxia is downstream of c-Src and K-ras.
A, Protein extracts from Caco2 and HT29 cells grown in normoxic or hypoxic conditions for the indicated times were subjected to immunoblotting for phospho-Akt and phospho-ERK1/2. The blots were then stripped and reprobed with antibodies against total Akt and total ERK. β-actin was used as a loading control. Densitometry values for p-Akt are expressed as fold change compared with control values normalized to 1. B, Caco2 cells were incubated for 1 hour with PP2 at the concentrations indicated, before transfer to normoxic or hypoxic conditions for 12 hours. Western blotting was performed to determine the levels of phospho-Akt, total Akt, phospho-Src416, and total Src. β-actin was used as a loading control. Densitometry values are expressed as fold change compared with control values normalized to 1. C, Caco2 cells were transfected with control siRNA, K-ras siRNA or c-Src siRNA oligos (each at 20 nM) before exposure to normoxic (N) or hypoxic (H) conditions for 12 hours. Immunoblotting with the indicated antibodies was then performed. Densitometry values for p-Akt are expressed as fold change compared with control values normalized to 1. D, Caco2 cells stably overexpressing K-rasV12 (Caco2pCSGWK-ras V12) were transfected with c-Src siRNA oligos. Forty-eight hours later, cells were incubated in hypoxia or normoxia for 12 hours and Western blotting with the indicated antibodies was then performed. Densitometry values for p-AKT are expressed as fold change compared with control values normalized to 1.
Figure 4
Figure 4. K-ras and Src enhance the survival of colon cancer cells in hypoxia.
A, DLD1, HCT116 and Caco2 cells were transfected with control siRNA or K-ras siRNA, and then incubated in hypoxia for 48 hours. Cell numbers were determined using a hemacytometer after staining with trypan blue and the results are expressed as percentages of viable cells compared with siRNA control transfected cells in normoxia. The data are from three independent experiments and shown as mean ± SD. *, P<0.05; **, P<0.01. B, Colo320DM cells grown on sterile coverslips were transfected with siRNA control oligos (shown in top rows) or siRNA oligos to K-ras (shown in bottom rows) for 24 hours, followed by incubation in hypoxia for 48 hours. Early apoptotic (FITC+PI-) and late apoptotic/necrotic cells (FITC+PI+) were detected. Left panels: 20x phase contrast and 20x fluorescence green and red channel merged images. Right panels: 20x and 40x fluorescence green and red channel merged images. C, Caco2 cells were transfected with K-ras siRNA or control siRNA, and then incubated in normoxia or hypoxia for 48 hours. Cell death was determined by FACS as described in Materials and Methods. D, Early apoptotic (Annexin V+PI-) and late apoptotic/necrotic (Annexin V+PI+) cells were determined by FACS analysis. Mean ± SD of three independent experiments is shown. *, P<0.05. **, P<0.01. E, DLD1, HCT116 and Caco2 cells were transfected with control siRNA or c-Src siRNA oligos (20 nM) for 24 hours and then exposed to hypoxia for 48 hours. Cells excluding trypan blue were counted and results are expressed as percentage of viable cells compared with siRNA control transfected cells in normoxia. Mean ± SD of three independent experiments is shown. *, P<0.05. **, P<0.01.
Figure 5
Figure 5. Hypoxic regulation of VEGF by K-ras.
A, Relative mRNA levels of VEGF, as evaluated by quantitative RT-PCR, in Caco2 cells transfected with a K-ras-specific siRNA construct or a non targeting control and exposed to normoxia or hypoxia. The data are expressed as fold change as compared to siRNA control cells in normoxia, normalized to 1. Columns, average of at least three experiments; bars, SEM. *, P<0.05 as compared to control cells. B, Caco2 cells were transiently transfected with either siRNA targeting endogenous K-ras or non targeting control siRNA. After 24 hours, a 2.3 kb VEGF-luciferase reporter construct was co-transfected with pRL-CMV and cells were incubated in normoxia or hypoxia for additional 24 hours. The data are expressed as fold change as compared to siRNA control cells in normoxia, normalized to 1. Columns, average of at least three experiments; bars, SEM. *, P<0.05 as compared to control cells. C, Supernatant from cells in (A) was collected, and an ELISA for VEGF was performed. The data are expressed as fold change as compared to siRNA control cells in normoxia, normalized to 1. Columns, average of at least three experiments; bars, SEM. *, P<0.05 as compared to control cells.
Figure 6
Figure 6. Induction of VEGF under hypoxic conditions is suppressed by inhibition of c-Src.
A and C, Relative mRNA levels of VEGF, as evaluated by quantitative RT-PCR, in Caco2 and HT29 cells pretreated with 10 µM PP2 (A) or transiently transfected with a Src-specific siRNA construct (C), and exposed to normoxia or hypoxia for 24 hours. The data are expressed as fold change as compared to control cells in normoxia, normalized to 1. *, P<0.05. B and D, VEGF luciferase reporter assays of Caco2 and HT29 cells, pretreated with 10 µM PP2 (B) or transiently transfected with a Src-specific siRNA construct (D), and exposed to normoxia or hypoxia for 24 hours. The results are from three independent experiments carried out in duplicate and are presented as fold change as compared with control cells in normoxia normalized to 1. Data are shown as mean ± SD. *, P<0.05. **, P<0.01.

References

    1. Vaupel P, Mayer A. Hypoxia in cancer: Significance and impact on clinical outcome. Cancer Metastasis Rev. 2007;26:225–239. - PubMed
    1. Zhang X, Gaspard JP, Chung DC. Regulation of vascular endothelial growth factor by the Wnt and K-Ras pathways in colonic neoplasia. Cancer Res. 2001;61:6050–6054. - PubMed
    1. Mizukami Y, Jo WS, Duerr EM, Gala M, Li J, et al. Induction of interleukin-8 preserves the angiogenic response in HIF-1alpha-deficient colon cancer cells. Nat Med. 2005;11:992–997. - PubMed
    1. Mizukami Y, Fujiki K, Duerr EM, Gala M, Jo WS, et al. Hypoxic regulation of vascular endothelial growth factor through the induction of phosphatidylinositol 3-kinase/Rho/ROCK and c-Myc. J Biol Chem. 2006;281:13957–13963. - PubMed
    1. Boguski MS, Mccormick F. Proteins regulating ras and its relatives. Nature. 1993;366:643–654. - PubMed

Publication types

Substances