. 2010 Jun 4;5(6):e10956.
doi: 10.1371/journal.pone.0010956.

Increased postprandial nonesterified fatty acid appearance and oxidation in type 2 diabetes is not fully established in offspring of diabetic subjects

Affiliations

Increased postprandial nonesterified fatty acid appearance and oxidation in type 2 diabetes is not fully established in offspring of diabetic subjects

François Normand-Lauzière et al. PLoS One. .

Abstract

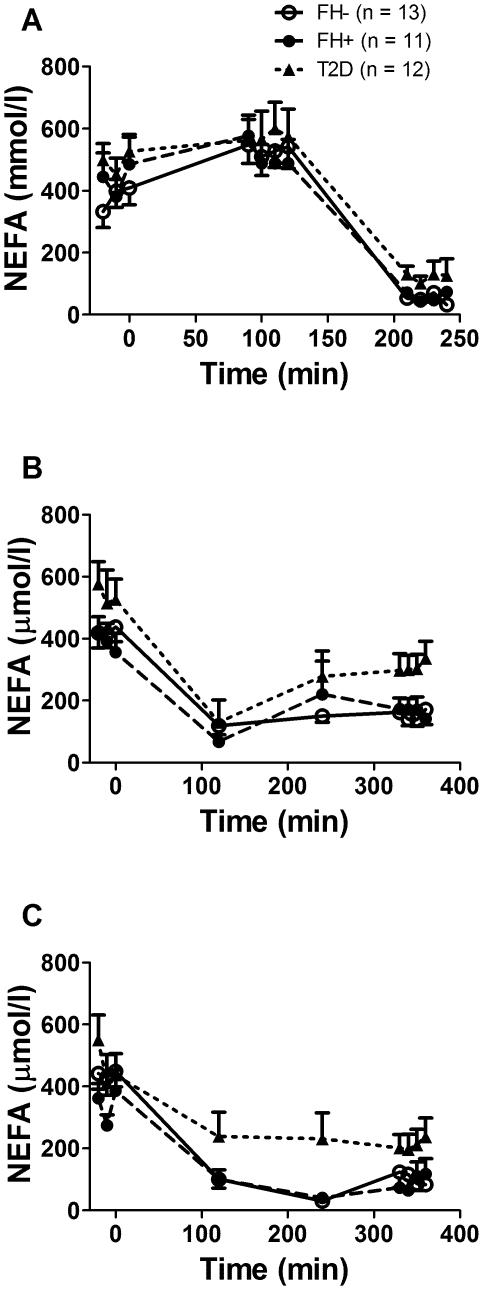
Background: It has been proposed that abnormal postprandial plasma nonesterified fatty acid (NEFA) metabolism may participate in the development of tissue lipotoxicity and type 2 diabetes (T2D). We previously found that non-diabetic offspring of two parents with T2D display increased plasma NEFA appearance and oxidation rates during intravenous administration of a fat emulsion. However, it is currently unknown whether plasma NEFA appearance and oxidation are abnormal during the postprandial state in these subjects at high-risk of developing T2D.

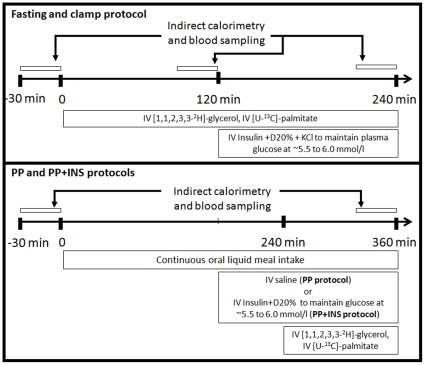
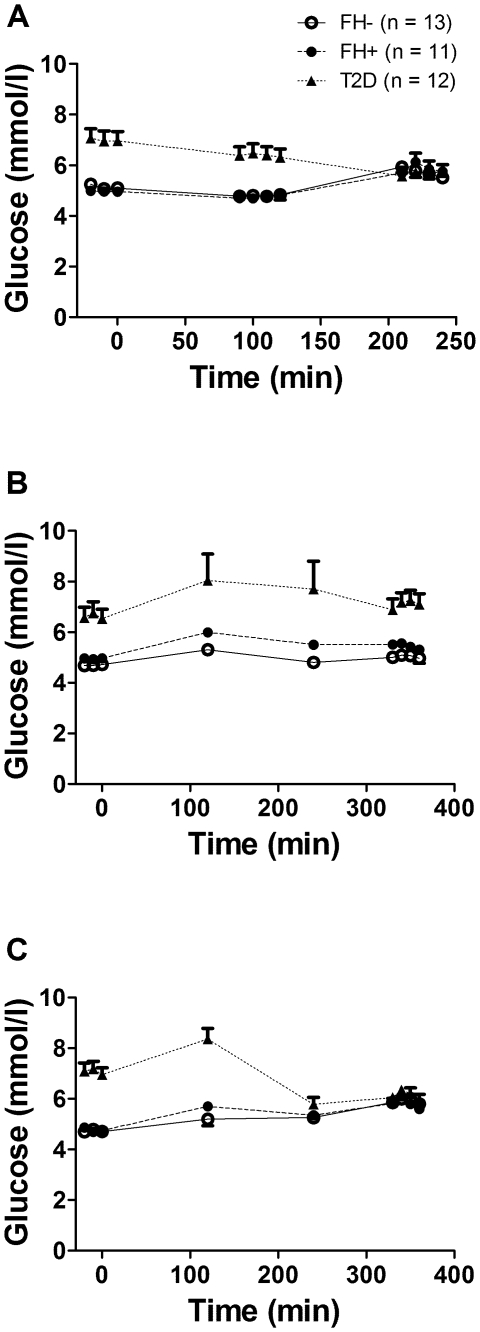
Methodology: Palmitate appearance and oxidation rates and glycerol appearance rate were determined in eleven healthy offspring of two parents with T2D (positive family history, FH+), 13 healthy subjects without first-degree relatives with T2D (FH-) and 12 subjects with T2D at fasting, during normoglycemic hyperinsulinemic clamp and during continuous oral intake of a standard liquid meal to achieve steady postprandial NEFA and triacylglycerols (TG) without and with insulin infusion to maintain similar glycemia in all three groups.

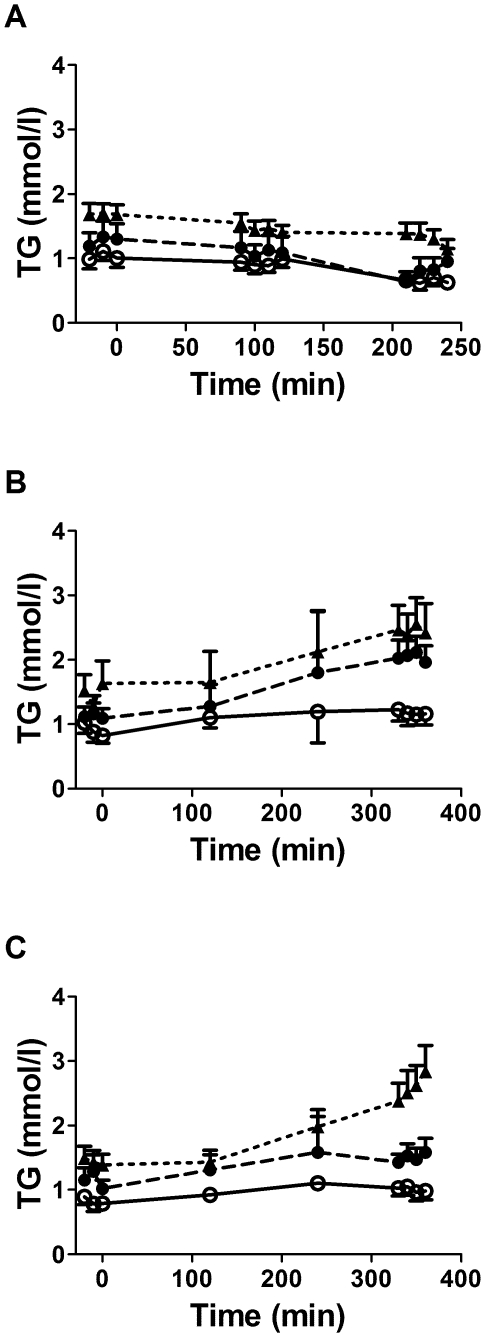
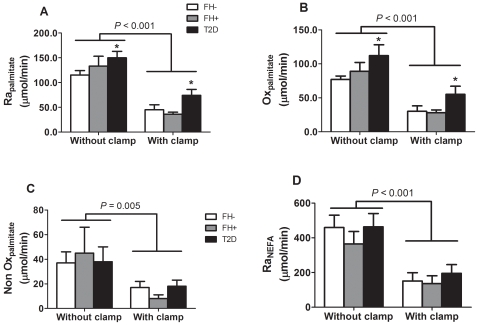
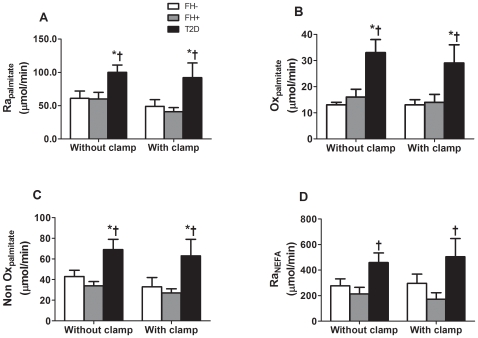
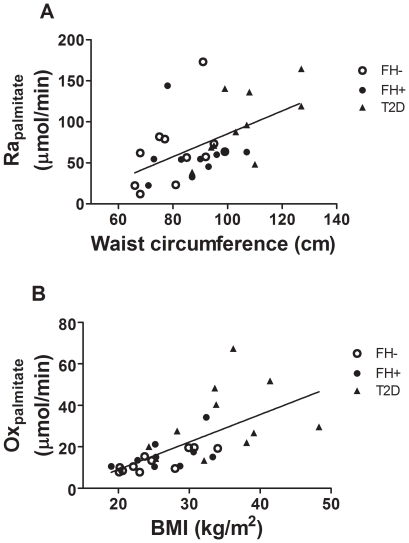
Principal findings: Plasma palmitate appearance and oxidation were higher at fasting and during the clamp conditions in the T2D group (all P<0.05). In the postprandial state, palmitate appearance, oxidative and non oxidative rates were all elevated in T2D (all P<0.05) but not in FH+. Both T2D and FH+ displayed elevated postprandial TG vs. FH- (P<0.001). Acute correction of hyperglycemia during the postprandial state did not affect these group differences. Increased waist circumference and BMI were positively associated with elevated postprandial plasma palmitate appearance and oxidation.

Conclusions/significance: Postprandial plasma NEFA intolerance observed in subjects with T2D is not fully established in non-diabetic offspring of both parents with T2D, despite the presence of increased postprandial plasma TG in the later. Elevated postprandial plasma NEFA appearance and oxidation in T2D is observed despite acute correction of the exaggerated glycemic excursion in this group.


Conflict of interest statement

Competing Interests: ACC has received a grant from the Canadian Institutes of Health Research regarding this work (acknowledged under financial disclosure).

Figures

Figure 1
Figure 1. Experimental protocols.
Each participant underwent three experimental protocols. The first protocol consisted, first, of a two-hour fasting experimental phase (time 0 to 120 min) followed by a two-hour normoglycemic hyperinsulinemic clamp (time 120 to 240 min) with determination of plasma glycerol and NEFA metabolism using stable isotopic tracers. The second protocol (postprandial or PP protocol) consisted in a 6-hour continuous oral intake of a standard liquid meal with determination of steady-state postprandial glycerol and NEFA metabolism using stable isotopic tracers. The third protocol (postprandial with exogenous insulin infusion or PP+INS protocol) was identical to the second protocol with the exception of intravenous insulin and dextrose infusion in the last 3 hours of the postprandial experiment to maintain normoglycemia (∼5.5 to 6.0 mmol/l) in all participants.
Figure 2
Figure 2. Plasma glucose over time during the experimental protocols.
Plasma glucose levels during the fasting and clamp protocol (A), the postprandial protocol (B) and the postprandial protocol with exogenous insulin infusion (C) in healthy subjects without first-degree family history of type 2 diabetes (open circles, continuous lines), in offspring of both parents with type 2 diabetes (closed circles, dashed lines) and in subjects with established type 2 diabetes (closed triangles, dotted lines). Data are mean ± SEM.
Figure 3
Figure 3. Plasma nonesterified fatty acids (NEFA) over time during the experimental protocols.
Plasma nonesterified fatty acid levels during the fasting and clamp protocol (A), the postprandial protocol (B) and the postprandial protocol with exogenous insulin infusion (C) in healthy subjects without first-degree family history of type 2 diabetes (open circles, continuous lines), in offspring of both parents with type 2 diabetes (closed circles, dashed lines) and in subjects with established type 2 diabetes (closed triangles, dotted lines). Data are mean ± SEM.
Figure 4
Figure 4. Plasma triacylglycerols (TG) over time during the experimental protocols.
Plasma triacylglycerol levels during the fasting and clamp protocol (A), the postprandial protocol (B) and the postprandial protocol with exogenous insulin infusion (C) in healthy subjects without first-degree family history of type 2 diabetes (open circles, continuous lines), in offspring of both parents with type 2 diabetes (closed circles, dashed lines) and in subjects with established type 2 diabetes (closed triangles, dotted lines). Data are mean ± SEM.
Figure 5
Figure 5. Plasma nonesterified fatty acid (NEFA) metabolism during fasting without and with euglycemic hyperinsulinemic clamp.
Plasma palmitate appearance (Rapalmitate – A), palmitate oxidative metabolism (Oxpalmitate – B), palmitate non oxidative metabolism (NonOxpalmitate – C) and nonesterified fatty acid appearance (RaNEFA – D) were not significantly different between healthy subjects without first-degree family history of type 2 diabetes (FH− – white bars) and offspring of both parents with type 2 diabetes (FH+ – grey bars). Subjects with established type 2 diabetes (T2D – black bars) had significantly higher Rapalmitate and Oxpalmitate than FH−. Rapalmitate, Oxpalmitate, NonOxpalmitate and RaNEFA were all significantly reduced during insulin clamp. * P<0.05 vs. FH−. Adjustment for age, waist circumference, BMI or insulin sensitivity, but not for gender, abolished difference between groups. Data are mean ± SEM.
Figure 6
Figure 6. Plasma nonesterified fatty acid (NEFA) metabolism during the postprandial state without and with euglycemic hyperinsulinemic clamp.
Plasma palmitate appearance (Rapalmitate – A), palmitate oxidative metabolism (Oxpalmitate – B), palmitate non oxidative metabolism (NonOxpalmitate – C) and nonesterified fatty acid appearance (RaNEFA – D) in healthy subjects without first-degree family history of type 2 diabetes (FH− – white bars), offspring of both parents with type 2 diabetes (FH+ – grey bars) and subjects with established type 2 diabetes (T2D –black bars). * P<0.05 vs. FH−. † P<0.05 vs. FH+. Adjustment for waist circumference, but not for age, gender, BMI or insulin sensitivity, abolished difference between groups. Data are mean ± SEM.
Figure 7
Figure 7. Major correlates of postprandial nonesterified fatty acid metabolism.
Correlation between postprandial plasma palmitate appearance rate (Rapalmitate) or palmitate oxidation rate (Oxpalmitate) and waist circumference (A) or BMI (B) in healthy subjects without first-degree family history of type 2 diabetes (FH−, open circles), in offspring of both parents with type 2 diabetes (FH+, closed circles) and in subjects with established type 2 diabetes (T2D, closed triangles).

Similar articles

Cited by

References

    1. Martin BC, Warram JH, Krolewski AS, Bergman RN, Soeldner JS, et al. Role of glucose and insulin resistance in development of type 2 diabetes mellitus: results of a 25-year follow-up study [see comments]. Lancet. 1992;340:925–929. - PubMed
    1. Axelsen M, Smith U, Eriksson JW, Taskinen MR, Jansson PA. Postprandial hypertriglyceridemia and insulin resistance in normoglycemic first-degree relatives of patients with type 2 diabetes. Annals of Internal Medicine. 1999;131:27–31. - PubMed
    1. Lewis GF, Carpentier A, Adeli K, Giacca A. Disordered fat storage and mobilization in the pathogenesis of insulin resistance and type 2 diabetes. Endocr Rev. 2002;23:201–229. - PubMed
    1. Brassard P, Frisch F, Lavoie F, Cyr D, Bourbonnais A, et al. Impaired plasma nonesterified fatty acid tolerance is an early defect in the natural history of type 2 diabetes. J Clin Endocrinol Metab. 2008;93:837–844. - PMC - PubMed
    1. Lavoie F, Frisch F, Brassard P, Normand-Lauziere F, Cyr D, et al. Relationship between Total and High Molecular Weight Adiponectin Levels and Plasma Nonesterified Fatty Acid Tolerance during Enhanced Intravascular Triacylglycerol Lipolysis in Men. J Clin Endocrinol Metab. 2009;94:998–1004. - PubMed

Publication types

Substances