

Optimality of mutation and selection in germinal centers
- PMID: 20532164
- PMCID: PMC2880589
- DOI: 10.1371/journal.pcbi.1000800
Optimality of mutation and selection in germinal centers
Abstract
The population dynamics theory of B cells in a typical germinal center could play an important role in revealing how affinity maturation is achieved. However, the existing models encountered some conflicts with experiments. To resolve these conflicts, we present a coarse-grained model to calculate the B cell population development in affinity maturation, which allows a comprehensive analysis of its parameter space to look for optimal values of mutation rate, selection strength, and initial antibody-antigen binding level that maximize the affinity improvement. With these optimized parameters, the model is compatible with the experimental observations such as the approximately 100-fold affinity improvements, the number of mutations, the hypermutation rate, and the "all or none" phenomenon. Moreover, we study the reasons behind the optimal parameters. The optimal mutation rate, in agreement with the hypermutation rate in vivo, results from a tradeoff between accumulating enough beneficial mutations and avoiding too many deleterious or lethal mutations. The optimal selection strength evolves as a balance between the need for affinity improvement and the requirement to pass the population bottleneck. These findings point to the conclusion that germinal centers have been optimized by evolution to generate strong affinity antibodies effectively and rapidly. In addition, we study the enhancement of affinity improvement due to B cell migration between germinal centers. These results could enhance our understanding of the functions of germinal centers.
Conflict of interest statement
The authors have declared that no competing interests exist.
Figures

 . Only 4.9% of the affinity affecting mutations could improve affinity.
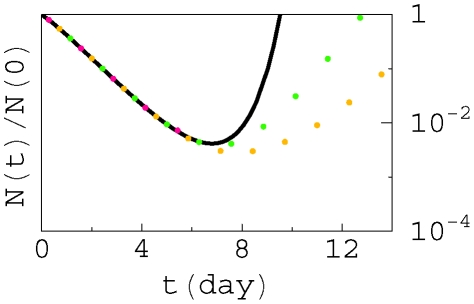
 (green),
  (yellow), and
  (red) respectively. The population in red goes extinct at the bottleneck.
 B cells) after going through the bottleneck, no matter how long it takes. (a): The optimal improvement of A occurs when about 50% daughter cells are mutated at divisions. (b): The grey scale shows the probability for the whole population to survive through the bottleneck. The black region at high mutation rate indicates lethal mutagenesis where there are too many lethal mutations for B cell population to increase.
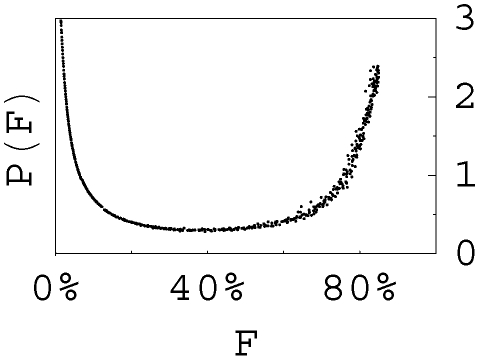
 , 50% mutated daughter cells, and selection strength
  . The calculation is terminated when the population in the GC recovers the initial size (3000 B cells), and F reaches 85% at the termination moment.
Similar articles
-
Dynamics of one-pass germinal center models: implications for affinity maturation.Bull Math Biol. 2000 Jan;62(1):121-53. doi: 10.1006/bulm.1999.0144. Bull Math Biol. 2000. PMID: 10824424
-
Multi-type Galton-Watson Processes with Affinity-Dependent Selection Applied to Antibody Affinity Maturation.Bull Math Biol. 2019 Mar;81(3):830-868. doi: 10.1007/s11538-018-00548-y. Epub 2018 Dec 7. Bull Math Biol. 2019. PMID: 30535847
-
Stochastic discrete event simulation of germinal center reactions.Phys Rev E Stat Nonlin Soft Matter Phys. 2005 May;71(5 Pt 1):051907. doi: 10.1103/PhysRevE.71.051907. Epub 2005 May 24. Phys Rev E Stat Nonlin Soft Matter Phys. 2005. PMID: 16089571
-
How to Simulate a Germinal Center.Methods Mol Biol. 2017;1623:303-334. doi: 10.1007/978-1-4939-7095-7_22. Methods Mol Biol. 2017. PMID: 28589364 Review.
-
The germinal center response.Crit Rev Immunol. 2004;24(1):39-65. doi: 10.1615/critrevimmunol.v24.i1.20. Crit Rev Immunol. 2004. PMID: 14995913 Review.
Cited by
-
Optimizing immunization protocols to elicit broadly neutralizing antibodies.Proc Natl Acad Sci U S A. 2020 Aug 18;117(33):20077-20087. doi: 10.1073/pnas.1919329117. Epub 2020 Aug 3. Proc Natl Acad Sci U S A. 2020. PMID: 32747563 Free PMC article.
-
Antibody V(h) repertoire differences between resolving and chronically evolving hepatitis C virus infections.PLoS One. 2011;6(9):e25606. doi: 10.1371/journal.pone.0025606. Epub 2011 Sep 28. PLoS One. 2011. PMID: 21980500 Free PMC article.
-
Optimal Sequential Immunization Can Focus Antibody Responses against Diversity Loss and Distraction.PLoS Comput Biol. 2017 Jan 30;13(1):e1005336. doi: 10.1371/journal.pcbi.1005336. eCollection 2017 Jan. PLoS Comput Biol. 2017. PMID: 28135270 Free PMC article.
-
A multi-scale model for correlation in B cell VDJ usage of zebrafish.Phys Biol. 2011 Oct;8(5):055006. doi: 10.1088/1478-3975/8/5/055006. Epub 2011 Aug 10. Phys Biol. 2011. PMID: 21832808 Free PMC article.
-
Immune perturbations in HIV-1-infected individuals who make broadly neutralizing antibodies.Sci Immunol. 2016 Jul 29;1(1):aag0851. doi: 10.1126/sciimmunol.aag0851. Epub 2016 Jul 29. Sci Immunol. 2016. PMID: 28783677 Free PMC article.
References
-
- MacLennan IC. Germinal centers. Annu Rev Immunol. 1994;12:117–139. - PubMed
-
- Rajewsky K. Clonal selection and learning in the antibody system. Nature. 1996;381:751–758. - PubMed
-
- Schwickert TA, Lindquist RL, Shakhar G, Livshits G, Skokos D, et al. In vivo imaging of germinal centres reveals a dynamic open structure. Nature. 2007;446:83–87. - PubMed
-
- Neuberger MS. Novartis Medal Lecture. Antibodies: a paradigm for the evolution of molecular recognition. Biochem Soc Trans. 2002;30:341–350. - PubMed
Publication types
MeSH terms
Grants and funding
LinkOut - more resources
Full Text Sources
Other Literature Sources
