

Symmetric allosteric mechanism of hexameric Escherichia coli arginine repressor exploits competition between L-arginine ligands and resident arginine residues
- PMID: 20532206
- PMCID: PMC2880562
- DOI: 10.1371/journal.pcbi.1000801
Symmetric allosteric mechanism of hexameric Escherichia coli arginine repressor exploits competition between L-arginine ligands and resident arginine residues
Abstract
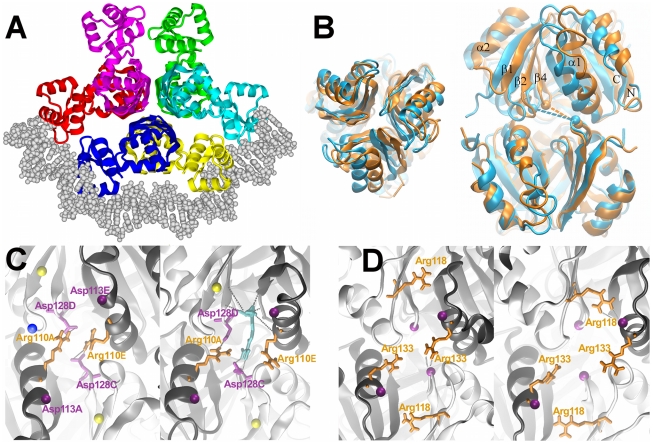
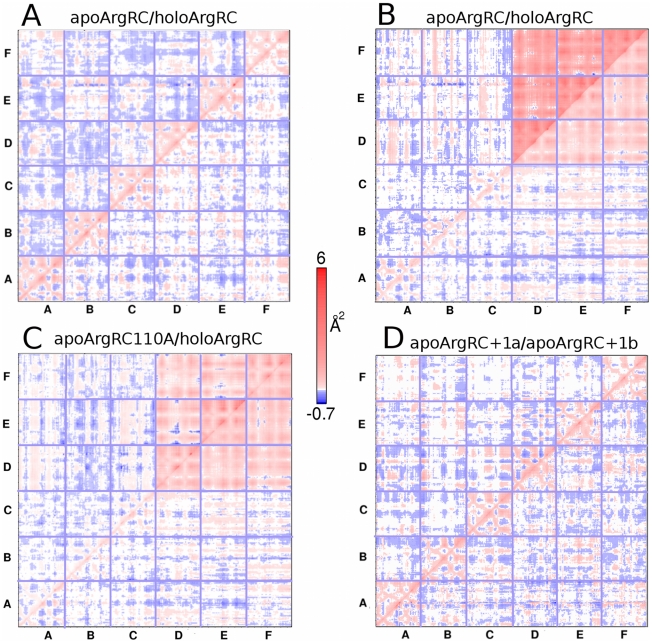
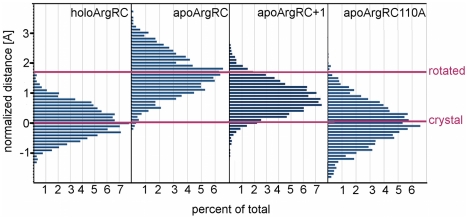
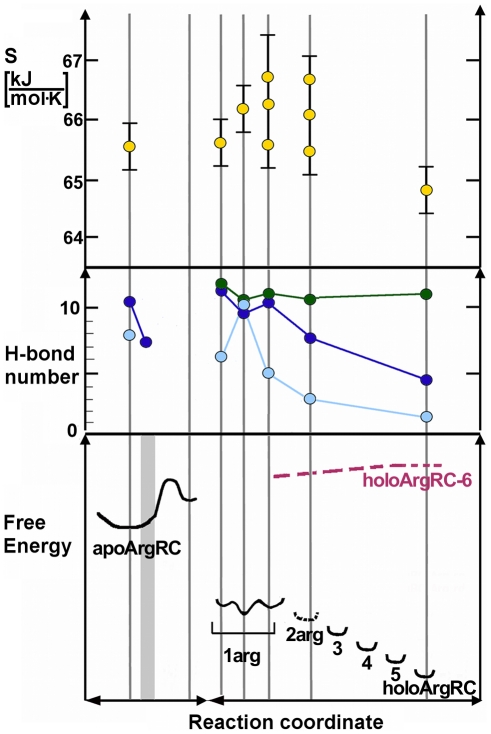
An elegantly simple and probably ancient molecular mechanism of allostery is described for the Escherichia coli arginine repressor ArgR, the master feedback regulator of transcription in L-arginine metabolism. Molecular dynamics simulations with ArgRC, the hexameric domain that binds L-arginine with negative cooperativity, reveal that conserved arginine and aspartate residues in each ligand-binding pocket promote rotational oscillation of apoArgRC trimers by engagement and release of hydrogen-bonded salt bridges. Binding of exogenous L-arginine displaces resident arginine residues and arrests oscillation, shifting the equilibrium quaternary ensemble and promoting motions that maintain the configurational entropy of the system. A single L-arg ligand is necessary and sufficient to arrest oscillation, and enables formation of a cooperative hydrogen-bond network at the subunit interface. The results are used to construct a free-energy reaction coordinate that accounts for the negative cooperativity and distinctive thermodynamic signature of L-arginine binding detected by calorimetry. The symmetry of the hexamer is maintained as each ligand binds, despite the conceptual asymmetry of partially-liganded states. The results thus offer the first opportunity to describe in structural and thermodynamic terms the symmetric relaxed state predicted by the concerted allostery model of Monod, Wyman, and Changeux, revealing that this state is achieved by exploiting the dynamics of the assembly and the distributed nature of its cohesive free energy. The ArgR example reveals that symmetry can be maintained even when binding sites fill sequentially due to negative cooperativity, which was not anticipated by the Monod, Wyman, and Changeux model. The molecular mechanism identified here neither specifies nor requires a pathway for transmission of the allosteric signal through the protein, and it suggests the possibility that binding of free amino acids was an early innovation in the evolution of allostery.
Conflict of interest statement
The authors have declared that no competing interests exist.
Figures
Similar articles
-
Conserved Dynamic Mechanism of Allosteric Response to L-arg in Divergent Bacterial Arginine Repressors.Molecules. 2020 May 10;25(9):2247. doi: 10.3390/molecules25092247. Molecules. 2020. PMID: 32397647 Free PMC article.
-
Binding-competent states for L-arginine in E. coli arginine repressor apoprotein.J Mol Model. 2014 Jul;20(7):2330. doi: 10.1007/s00894-014-2330-5. Epub 2014 Jun 21. J Mol Model. 2014. PMID: 24952066
-
Quantitative analysis of DNA binding by the Escherichia coli arginine repressor.J Mol Biol. 2001 Oct 5;312(5):949-62. doi: 10.1006/jmbi.2001.4941. J Mol Biol. 2001. PMID: 11580241
-
From feedback inhibition to allostery: the enduring example of aspartate transcarbamoylase.FEBS J. 2014 Jan;281(2):612-20. doi: 10.1111/febs.12483. Epub 2013 Sep 5. FEBS J. 2014. PMID: 23953008 Review.
-
Regulating transcription regulators via allostery and flexibility.Proc Natl Acad Sci U S A. 2009 Dec 29;106(52):22035-6. doi: 10.1073/pnas.0912300107. Epub 2009 Dec 23. Proc Natl Acad Sci U S A. 2009. PMID: 20080782 Free PMC article. Review. No abstract available.
Cited by
-
How does symmetry impact the flexibility of proteins?Philos Trans A Math Phys Eng Sci. 2013 Dec 30;372(2008):20120041. doi: 10.1098/rsta.2012.0041. Print 2014 Feb 13. Philos Trans A Math Phys Eng Sci. 2013. PMID: 24379431 Free PMC article.
-
Conserved Dynamic Mechanism of Allosteric Response to L-arg in Divergent Bacterial Arginine Repressors.Molecules. 2020 May 10;25(9):2247. doi: 10.3390/molecules25092247. Molecules. 2020. PMID: 32397647 Free PMC article.
-
Diversity, versatility and complexity of bacterial gene regulation mechanisms: opportunities and drawbacks for applications in synthetic biology.FEMS Microbiol Rev. 2019 May 1;43(3):304-339. doi: 10.1093/femsre/fuz001. FEMS Microbiol Rev. 2019. PMID: 30721976 Free PMC article. Review.
-
Binding-competent states for L-arginine in E. coli arginine repressor apoprotein.J Mol Model. 2014 Jul;20(7):2330. doi: 10.1007/s00894-014-2330-5. Epub 2014 Jun 21. J Mol Model. 2014. PMID: 24952066
-
Molecular dynamics comparison of E. coli WrbA apoprotein and holoprotein.J Mol Model. 2014 Sep;20(9):2400. doi: 10.1007/s00894-014-2400-8. Epub 2014 Aug 26. J Mol Model. 2014. PMID: 25152065
References
-
- Szwajkajzer D, Dai L, Fukayama JW, Abramczyk B, Fairman R, et al. Quantitative analysis of DNA binding by the Escherichia coli arginine repressor. J Mol Biol. 2001;312:949–962. - PubMed
-
- Monod J, Changeux JP, Jabcob F. Allosteric proteins and cellular contorol systems. J Mol Biol. 1963;6:306–329. - PubMed
-
- Czaplewski LG, North AK, Smith MC, Baumberg S, Stockley PG. Purification and initial characterization of AhrC: The regulator of arginine metabolism genes in Bacillus subtilis. Mol Microbiol. 1992;6:267–275. - PubMed
Publication types
MeSH terms
Substances
LinkOut - more resources
Full Text Sources
