. 2010 Jun 3;6(6):e1000935.
doi: 10.1371/journal.ppat.1000935.

The epigenetic landscape of latent Kaposi sarcoma-associated herpesvirus genomes

Affiliations

The epigenetic landscape of latent Kaposi sarcoma-associated herpesvirus genomes

Thomas Günther et al. PLoS Pathog. .

Abstract

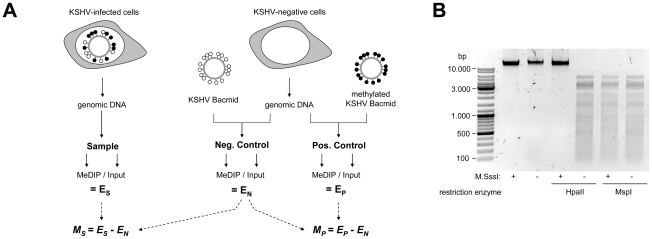
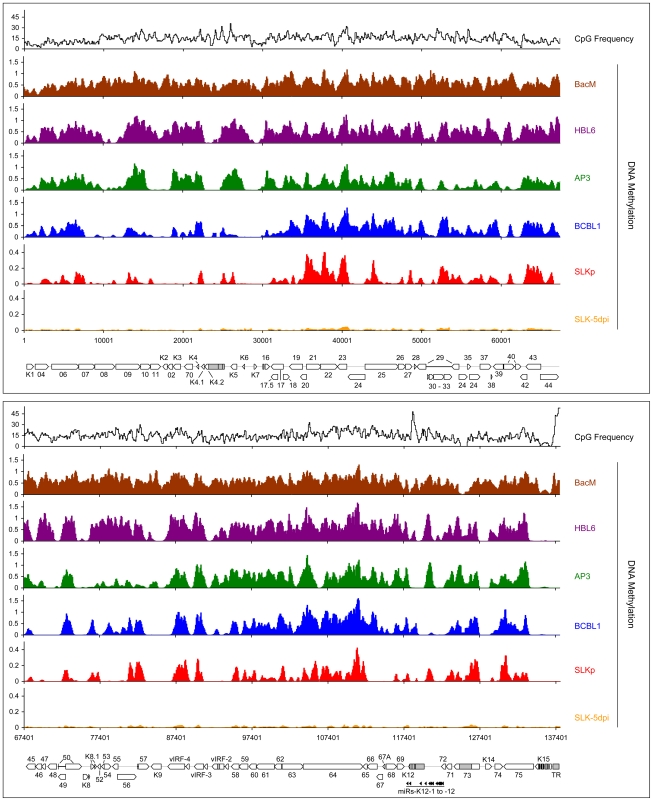
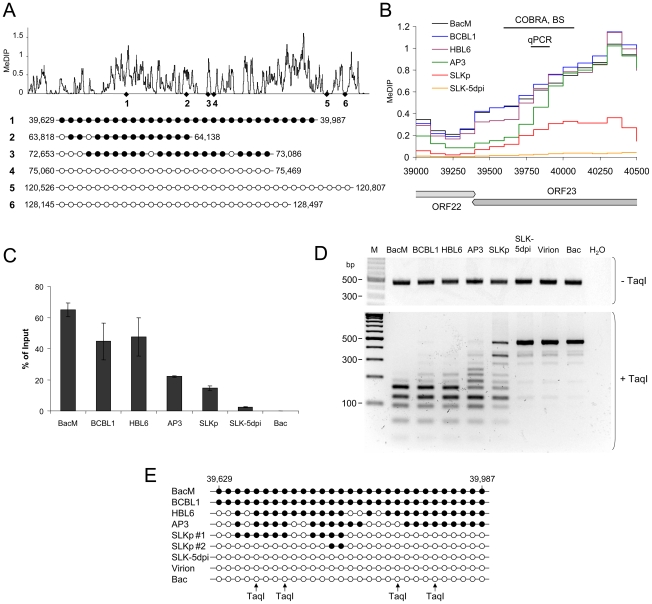
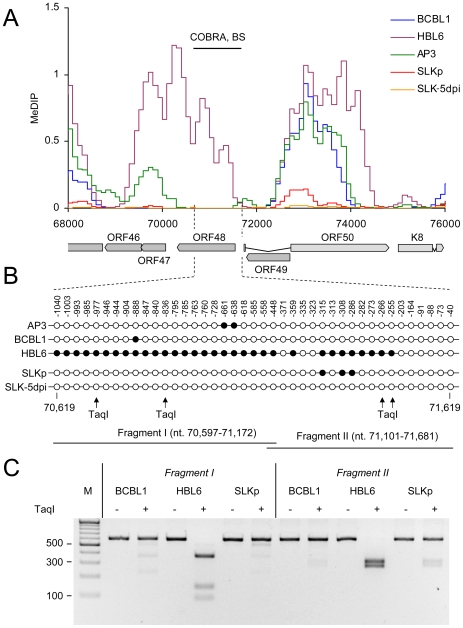
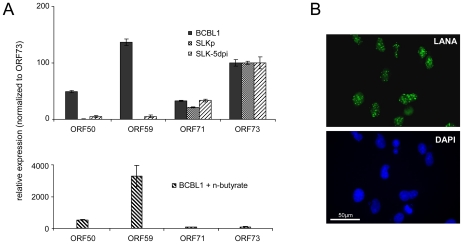
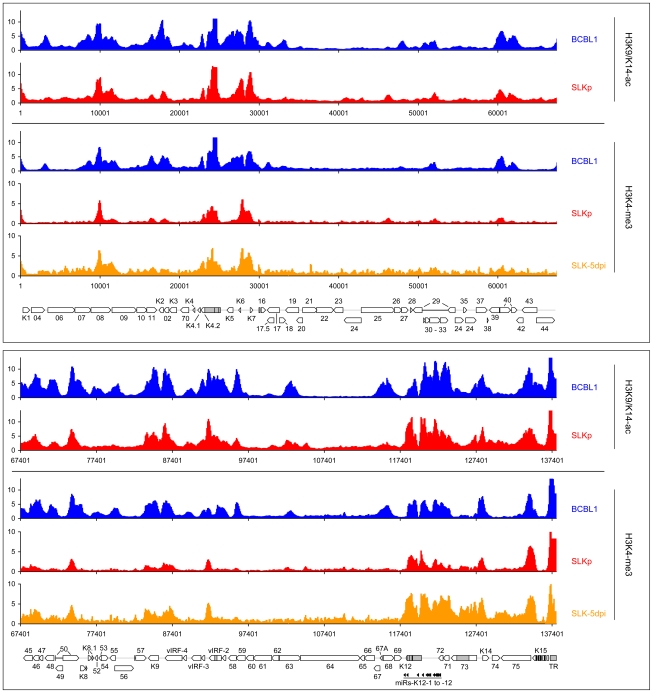
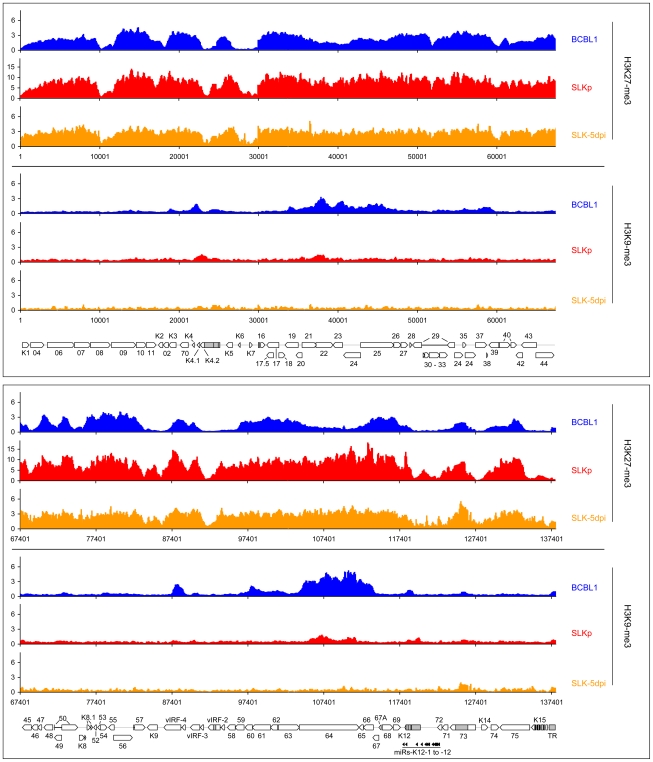
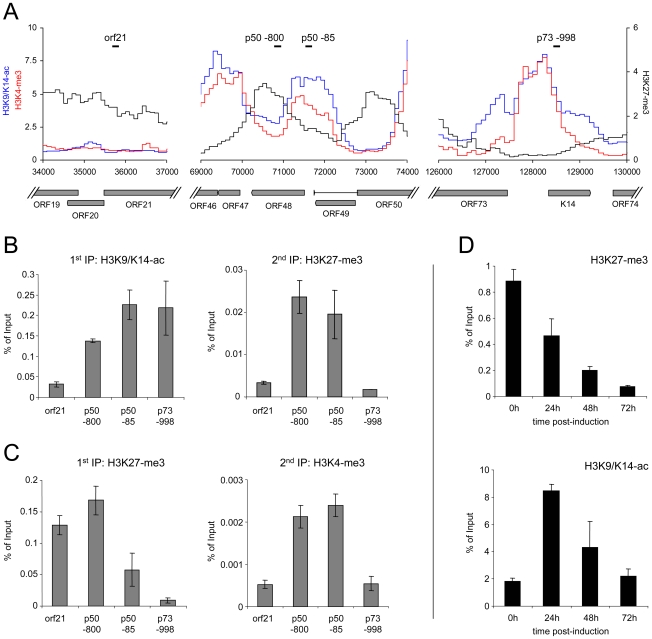
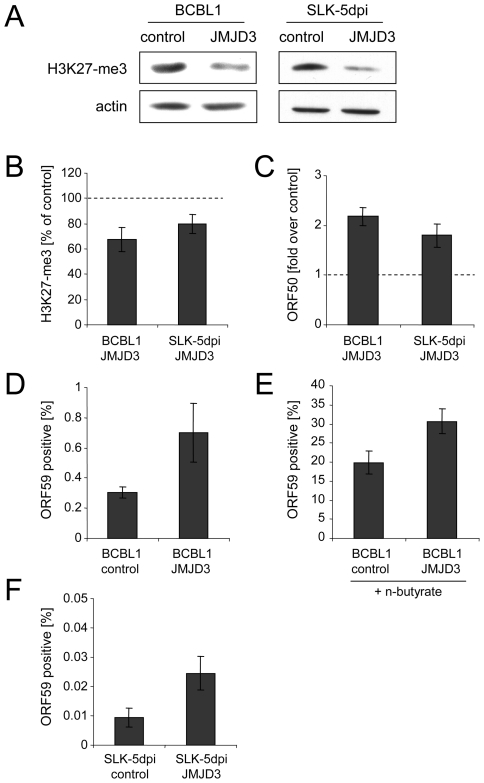
Herpesvirus latency is generally thought to be governed by epigenetic modifications, but the dynamics of viral chromatin at early timepoints of latent infection are poorly understood. Here, we report a comprehensive spatial and temporal analysis of DNA methylation and histone modifications during latent infection with Kaposi Sarcoma-associated herpesvirus (KSHV), the etiologic agent of Kaposi Sarcoma and primary effusion lymphoma (PEL). By use of high resolution tiling microarrays in conjunction with immunoprecipitation of methylated DNA (MeDIP) or modified histones (chromatin IP, ChIP), our study revealed highly distinct landscapes of epigenetic modifications associated with latent KSHV infection in several tumor-derived cell lines as well as de novo infected endothelial cells. We find that KSHV genomes are subject to profound methylation at CpG dinucleotides, leading to the establishment of characteristic global DNA methylation patterns. However, such patterns evolve slowly and thus are unlikely to control early latency. In contrast, we observed that latency-specific histone modification patterns were rapidly established upon a de novo infection. Our analysis furthermore demonstrates that such patterns are not characterized by the absence of activating histone modifications, as H3K9/K14-ac and H3K4-me3 marks were prominently detected at several loci, including the promoter of the lytic cycle transactivator Rta. While these regions were furthermore largely devoid of the constitutive heterochromatin marker H3K9-me3, we observed rapid and widespread deposition of H3K27-me3 across latent KSHV genomes, a bivalent modification which is able to repress transcription in spite of the simultaneous presence of activating marks. Our findings suggest that the modification patterns identified here induce a poised state of repression during viral latency, which can be rapidly reversed once the lytic cycle is induced.


Conflict of interest statement

The authors have declared that no competing interests exist.

Figures

Figure 1
Figure 1. Experimental design of MeDIP analysis.
A: Schematic representation of the experimental setup for the analysis of CpG methylation patterns. The KSHV episome in infected cells is expected to be partially methylated, as indicated by black and white circles which symbolize methylated or unmethylated CpG dinucleotides, respectively. Genomic DNA was isolated from such cells and the samples were subjected to immunoprecipitation using a methylcytidine specific antibody (MeDIP procedure), followed by hybridization of the precipitated samples versus the input on tiling microarrays. For each probe, an enrichment score ES was calculated, which represents the ratio of MeDIP over input fluorescence signals. The efficiency of the immunoprecipitation depends on the total number of methylated CpG motifs in a given fragment and ES is thus a function of the extend of methylation as well as local CpG frequencies. Therefore, to obtain reference values which signify maximum methylation for each probe, we generated a positive control by subjecting KSHV bacmids to CpG methylation in vitro. The bacmid was mixed with cellular DNA to simulate the host background and subjected to the same MeDIP procedure as samples from infected cells. Similarly, a negative control of unmethylated bacmid was prepared to control for cross-hybridization of unspecific background. After normalization of the array data using a spike-in control (see Material & Methods for details), background-corrected methylation values MS and MP were calculated for each probe by subtraction of the corresponding negative control value. B: Confirmation of successful in vitro methylation of KSHV bacmids used as a positive control. A bacmid carrying the complete KSHV genome (BAC36 [36]) was methylated using M.SssI, a methyltransferase specific for CpG dinucleotides. Methylated or unmethylated bacmids were subjected to restriction digestion using the methylation sensitive enzyme HpaII and its isoschizomer MspI, which cuts regardless of methylation. Methylated bacmids were resistant to HpaII digestion, signifying complete methylation.
Figure 2
Figure 2. Global DNA methylation patterns of latent KSHV genomes.
Global DNA methylation patterns of KSHV genomes in PEL cells (HBL6, AP3 and BCBL1), long-term in vitro infected endothelial SLK cells (SLKp) or SLK cultures 5 days after de novo infection with KSHV (SLK-5dpi) were determined by MeDIP array analysis as described in the text. The profile observed for the positive control, consisting of a completely methylated KSHV bacmid mixed with cellular DNA, is also shown (BacM). CpG methylation values are shown on the y-axis for overlapping 250 bp sequence windows, shifted along the KSHV genome in increments of 100 bp. Methylation values of individual windows represent the mean of background-corrected methylation values from all probes matching either strand of the window (see Material & Methods for details). The number of CpG dinucleotides which are present in each sequence window are shown at the top. The nucleotide positions and genome map shown at the bottom of each panel refer to the reference KSHV sequence (NC_009333). Open reading frames and repeat regions are indicated as block arrows and grey boxes, respectively.
Figure 3
Figure 3. Verification of MeDIP microarray results.
Bisulfite sequencing (BS), COBRA analysis and real-time qPCR were used to confirm KSHV DNA methylation profiles at select loci. A: Three loci for which our MeDIP analysis had indicated profound methylation, and three loci which were predicted to be unmethylated were analyzed by bisulfite sequencing of BCBL1-derived DNA. The global BCBL1 MeDIP methylation profile and the location of sequenced regions are shown for reference at the top. The results of the bisulfite sequencing are shown underneath, where closed and open circles indicate methylated and unmethylated CpG motifs, respectively. The nucleotide positions indicate the position of the first and the last CpG motifs within the KSHV reference genome (NC_009333). B–E: Confirmation of DNA methylation profiles at the genomic ORF23 locus in PEL cells (HBL6, AP3 and BCBL1), long-term in vitro infected endothelial SLK cells (SLKp), SLK cultures 5 days after de novo infection (SLK-5dpi), in vitro methylated or unmethylated KSHV bacmids (BacM and Bac, respectively), and virion DNA. The methylation profiles of the samples investigated by MeDIP are shown in B. Black lines indicate the regions for which COBRA analysis and bisulfite sequencing of genomic DNA, or real-time qPCR of MeDIP samples were performed. C: Real-time qPCR was performed to quantify immunoprecipitated DNA from three independent MeDIP experiments. Values were calculated as percent of the input and were normalized to an internal control consisting of methylated plasmid DNA (pCR2.1) spiked into each sample prior to MeDIP. D+E: the region indicated in B was PCR-amplified from bisulfite converted DNA and subjected to a COBRA assay (D) or bisulfite sequencing (E). Cleavage of bisulfite converted DNA at the TaqI sites indicated by arrows requires methylation of the corresponding CpG motif. The CpG profiles as shown in E were determined by bulk sequencing reactions except for the samples labeled SLKp #1 and #2, which represent two individual clones from the SLKp line.
Figure 4
Figure 4. DNA Methylation at the ORF50 promoter.
A: Methylation profiles of KSHV infected cells at the ORF50 promoter (see legend to Figure 3 for abbreviations). The region investigated by COBRA and bisulfite sequencing is indicated by the black bar above and hashed lines underneath the graph. B: Results of bisulfite sequencing of genomic DNA from BCBL1, HBL6 or SLKp cells. Closed and open circles indicate methylated and unmethylated CpG motifs, respectively. Numbers above each circle indicate the position of the motif relative to the ORF50 transcriptional start. The nucleotide positions shown underneath indicate the position of the first and the last CpG motifs within the KSHV reference genome (NC_009333). The position of TaqI restriction sites in bisulfite converted DNA is indicated by arrows (conservation of the sites requires methylation of the corresponding CpG motif). The black bars labeled “Fragment I” and “II” represent the two overlapping PCR fragments which were amplified and sequenced, and which were further analyzed by COBRA as shown in C.
Figure 5
Figure 5. Latent KSHV expression patterns of SLKP and de novo infected SLK cells.
A: Expression of select latent (ORF71, ORF73) and lytic (ORF50, ORF59) transcripts was analyzed by quantitative RT-PCR in BCBL1 cells, long-term infected SLKP cells and de novo infected SLK cultures at day 5 post infection (SLK-5dpi). Levels were normalized to represent expression relative to ORF73, which is expressed during the latent as well as the lytic cycle. Compared to BCBL1, SLK-5dpi cells show little expression of lytic antigens, and expression was undetectable in SLKp cells. The detection of lytic transcripts in latent BCBL1 cultures is due to the low percentage (less than 1%) of cells which undergo spontaneous lytic reactivation. The percentage of lytic cells and thus transcript levels can be increased by treatment such as sodium butyrate (lower panel). Spontaneously reactivating cells are completely absent from SLKp cells, which is in accordance with the lack of detectable lytic gene expression. B: Immunofluorescence staining of SLK-5dpi cultures for LANA, the product of ORF73. DAPI staining is shown in the lower panel. More than 90% of the cells tested positive for LANA, while expression of the lytic DNA polymerase processivity factor encoded by ORF59 could be detected in less than 0.01% of cells (compare also left column in Figure 9F).
Figure 6
Figure 6. Global patterns of H3K9/K14 Acetylation and H3K4 tri-methylation on latent KSHV genomes.
Global patterns of H3K9/K14 Acetylation (H3K9/K14-ac) of KSHV genomes in BCBL1 and SLKp cells, as well as H3K4 tri-methylation (H3K4-me3) patterns in BCBL1, SLKp and SLK cultures at 5 days post infection (SLK-5dpi) were analyzed by ChIP-on-chip assays as described in the text. Values shown on the y-axis represent relative enrichment of normalized signals from the immunoprecipitated material over input, calculated for overlapping sequence windows of 250 bp by averaging the values from all matching probes, as described in the legend to Figure 1 and the Material & Methods section. See legend to Figure 1 for explanation of map elements displayed at the bottom of each panel.
Figure 7
Figure 7. Global patterns of H3K27 and H3K9 tri-methylation on latent KSHV genomes.
Global patterns of histone H3 tri-methylated at lysine 27 (H3K27-me3) or 9 (H3K9-me3) on KSHV genomes in BCBL1, SLKp cells as well as SLK cultures at 5 days post infection (SLK-5dpi) were analyzed by performing ChIP-on-chip assays as described in the text. Values shown on the y-axis represent relative enrichment of normalized signals from immunoprecipitated material over input, calculated for overlapping sequence windows of 250 bp by averaging the values from all matching probes, as described in the legend to Figure 1 and the Material & Methods section. See legend to Figure 1 for explanation of map elements displayed at the bottom of each panel.
Figure 8
Figure 8. Bivalent histone modification patterns at the ORF50 promoter are reversed upon induction of the lytic cycle.
A: Profiles of H3K9/K14-ac (blue), H3K4-me3 (red) and H3K27-me3 (black) histone modifications at the ORF21 (left), ORF50 (center) and ORF73 (right) loci of BCBL1 cells. Black bars indicate the location of regions amplified by quantitative PCR in the sequential ChIP and lytic reactivation experiments shown in B–D. B, C: Sequential ChIP experiments carried out with antibodies directed against H3K9/K14-ac and H3K27-me3 during the first and second rounds of immunoprecipitation, respectively (B), or with antibodies against H3K27-me3 during the first ChIP, followed by H3K4-me3 specific antibodies for the second immunoprecipitation (C). For the first as well as the second round of immunoprecipitation, numbers on the y-axis indicate the percentage of recovered material relative to the total starting material (i.e., the amount of DNA which was used as the input during the first ChIP). D: Reversal of H3K27-me3 marks at the ORF50 promoter upon lytic reactivation. BCBL1 cells were treated with 0.3mM sodium butyrate to induce the lytic cycle. ChIP experiments were performed at the indicated time points to monitor changes in H3K27-me3 and H3K9/K14-ac modification patterns, using quantitative PCR with primers specific for the p50 −800 region as shown in A.
Figure 9
Figure 9. Consequences of JMJD3 expression in BCBL1 and de novo infected SLK cells.
A: Reduction of global H3K27-me3 levels in BCBL1 (left) or SLK cells (right) after 2 weeks of transduction with a JMJD3-expressing retrovirus (right lanes in each panel) or with an empty control virus (left lanes). Western blots were simultaneously stained with antibodies specific for H3K27-me3 as well as actin. B–F: Analysis of JMJD3-transduced BCBL1 cells, as well as JMJD3-transduced SLK cells after 5 days of infection with KSHV. B: H3K27-me3 status of the ORF50 promoter, as judged by ChIP analysis followed by real-time qPCR with primers amplifying the p50 −800 region shown in Figure 8A. Values are shown as relative levels in JMJD3-transduced compared to the control cells, which were set to 100%. C: ORF50 transcription as judged by quantitative PCR. Values are given as fold transcript levels in JMJD3-transduced cells compared to control cultures (set to 1). D and F: Percentage of spontaneously reactivating cells (as judged by immunofluorescence staining for the product of ORF59) in JMJD3 expressing BCBL1 (D) or SLK (F) cells, or the corresponding control cultures. E: Percentage of ORF59 positive cells after induction of BCBL1 cells with sodium butyrate for 72h.

References

    1. Pellett PE, Roizman B. The family herpesviridae: A brief introduction. In: Knipe DM, Howley PM, Griffin DE, Lamb RA, Martin MA, editors. Fields virology. Philadelphia: Lippincott Williams & Wilkins; 2001. pp. 2381–2398.
    1. Cesarman E, Chang Y, Moore PS, Said JW, Knowles DM. Kaposi's sarcoma-associated herpesvirus-like DNA sequences in AIDS-related body-cavity-based lymphomas. N Engl J Med. 1995;332:1186–1191. - PubMed
    1. Chang Y, Cesarman E, Pessin MS, Lee F, Culpepper J, et al. Identification of herpesvirus-like DNA sequences in AIDS-associated Kaposi's sarcoma. Science. 1994;266:1865–1869. - PubMed
    1. Soulier J, Grollet L, Oksenhendler E, Cacoub P, Cazals-Hatem D, et al. Kaposi's sarcoma-associated herpesvirus-like DNA sequences in multicentric Castleman's disease. Blood. 1995;86:1276–1280. - PubMed
    1. Dupin N, Fisher C, Kellam P, Ariad S, Tulliez M, et al. Distribution of human herpesvirus-8 latently infected cells in Kaposi's sarcoma, multicentric Castleman's disease, and primary effusion lymphoma. Proc Natl Acad Sci U S A. 1999;96:4546–4551. - PMC - PubMed

Publication types

MeSH terms