

doi: 10.1371/journal.pbio.1000385.
Distorted views of biodiversity: spatial and temporal bias in species occurrence data
Affiliations
- PMID: 20532234
- PMCID: PMC2879389
- DOI: 10.1371/journal.pbio.1000385
Item in Clipboard
Distorted views of biodiversity: spatial and temporal bias in species occurrence data
PLoS Biol.
.
Abstract
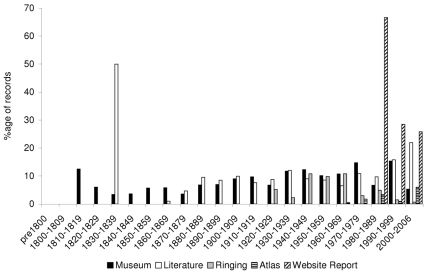
Boakes et al. compile and analyze a historical dataset of 170,000 bird sightings over two centuries and show how changing trends in data gathering may confound a true picture of biodiversity change.
Conflict of interest statement
The authors have declared that no competing interests exist.
Figures
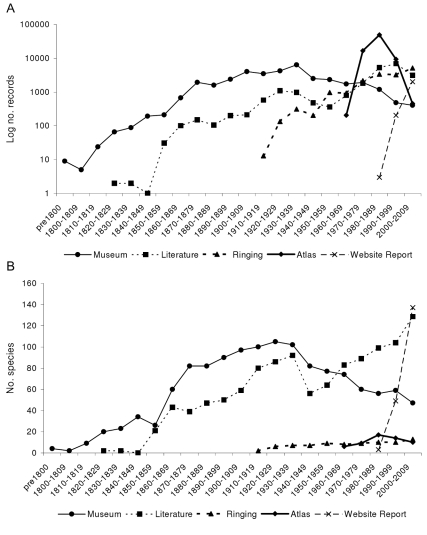
A) shows the number of records contributed by each data source within each time period, and B) shows the number of species recorded by each data source within each time period. The number of records for 2000–2006 has been extrapolated to 2000–2009 for ease of comparison with the other decades.
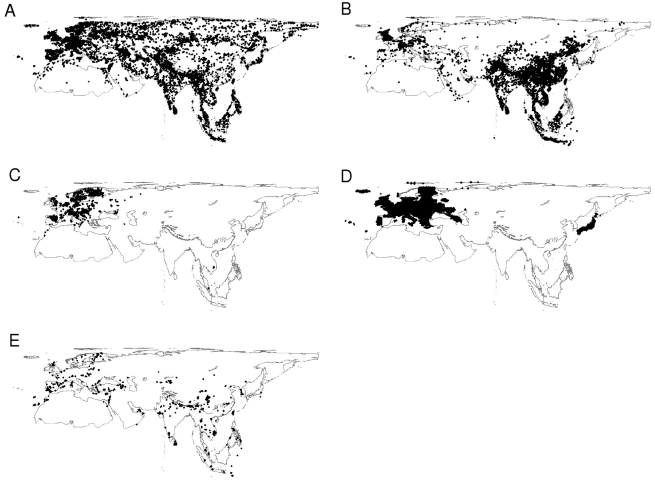
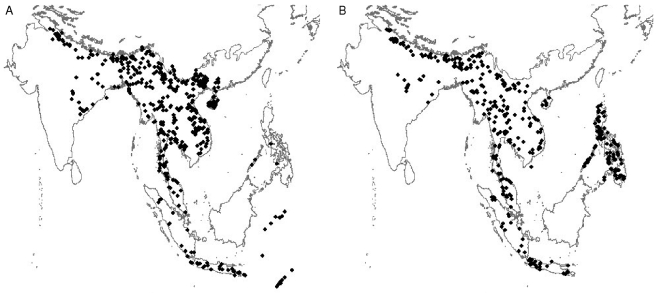
A) museums, B) literature, C) ringing, D) atlas, and E) website trip reports.
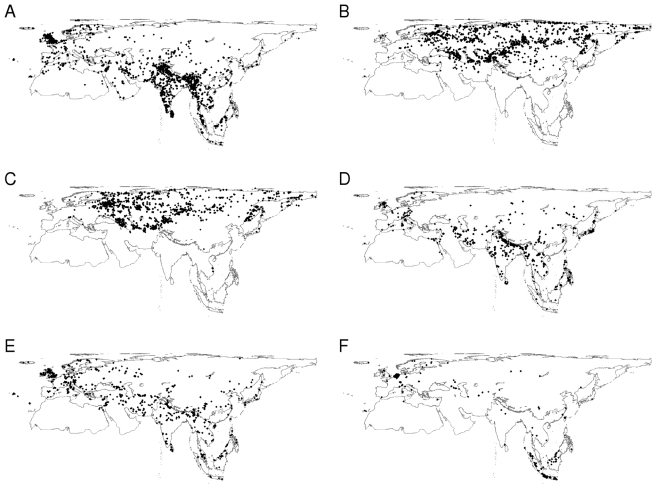
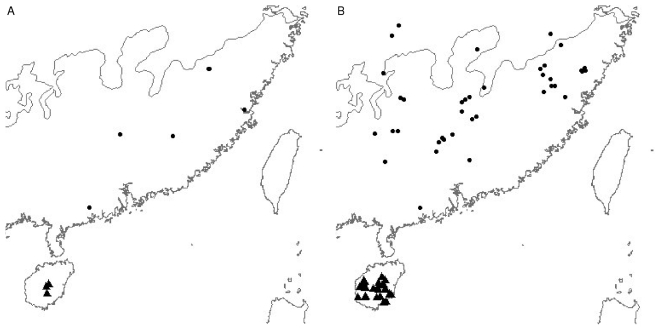
A) Natural History Museum, London (BMNH), B) Zoological Institute of the Russian Academy of Sciences, St. Petersburg (ZISP), C) Zoological Museum of Moscow University (ZMMU), D) Field Museum of Natural History (FMNH), E) American Museum of Natural History (AMNH), and F) National Museum of Natural History, Leiden (NNM).
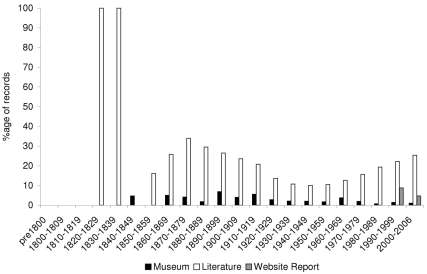
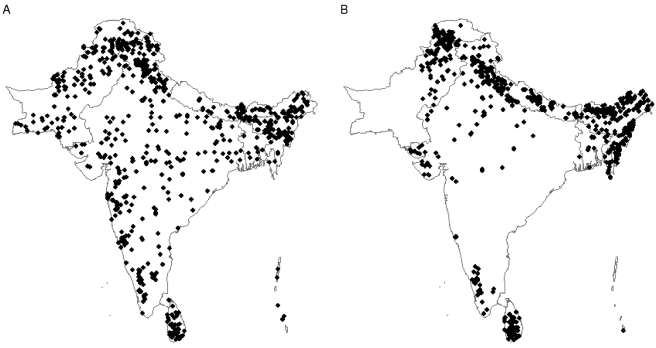
For reference, 30% of the species in the database are currently threatened.
References
-
- UNEP (United Nations Environment Programme) Nairobi: UNEP; 2002. Report on the sixth meeting of the Conference of the Parties to the Convention on Biological Diversity (UNEP/CBD/COP/20/Part 2) Strategic Plan Decision VI/26 in CBD.
-
- Balmford A, Bennun L, ten Brink B, Cooper D, Cote I. M, et al. The convention on biological diversity's 2010 target. Science. 2005;307:212–213. - PubMed
-
- Collen B, Loh J, Whitmee S, McRae L, Amin R, et al. Monitoring Change in Vertebrate Abundance: the Living Planet Index. Conserv Biol. 2009;23:317–327. - PubMed
-
- Sheppard C. The Shifting Baseline Syndrome. Mar Pollut Bull. 1995;30:766–767.
Publication types
MeSH terms
LinkOut - more resources
Full Text Sources
Other Literature Sources
