

Recurrent, robust and scalable patterns underlie human approach and avoidance
- PMID: 20532247
- PMCID: PMC2879576
- DOI: 10.1371/journal.pone.0010613
Recurrent, robust and scalable patterns underlie human approach and avoidance
Abstract
Background: Approach and avoidance behavior provide a means for assessing the rewarding or aversive value of stimuli, and can be quantified by a keypress procedure whereby subjects work to increase (approach), decrease (avoid), or do nothing about time of exposure to a rewarding/aversive stimulus. To investigate whether approach/avoidance behavior might be governed by quantitative principles that meet engineering criteria for lawfulness and that encode known features of reward/aversion function, we evaluated whether keypress responses toward pictures with potential motivational value produced any regular patterns, such as a trade-off between approach and avoidance, or recurrent lawful patterns as observed with prospect theory.
Methodology/principal findings: Three sets of experiments employed this task with beautiful face images, a standardized set of affective photographs, and pictures of food during controlled states of hunger and satiety. An iterative modeling approach to data identified multiple law-like patterns, based on variables grounded in the individual. These patterns were consistent across stimulus types, robust to noise, describable by a simple power law, and scalable between individuals and groups. Patterns included: (i) a preference trade-off counterbalancing approach and avoidance, (ii) a value function linking preference intensity to uncertainty about preference, and (iii) a saturation function linking preference intensity to its standard deviation, thereby setting limits to both.
Conclusions/significance: These law-like patterns were compatible with critical features of prospect theory, the matching law, and alliesthesia. Furthermore, they appeared consistent with both mean-variance and expected utility approaches to the assessment of risk. Ordering of responses across categories of stimuli demonstrated three properties thought to be relevant for preference-based choice, suggesting these patterns might be grouped together as a relative preference theory. Since variables in these patterns have been associated with reward circuitry structure and function, they may provide a method for quantitative phenotyping of normative and pathological function (e.g., psychiatric illness).
Conflict of interest statement
Figures


 (y axis) vs.
  (x axis) for BF, AF, BM, AM faces in 77 healthy control subjects [experimental conditions (i.e., stimulus categories) are color coded as indicated in (b)]. The central tendency of the
  manifold is approximated by a black quarter-circle, with its dispersion via crossbars and mathematical formulation as
  , where N = the number of items in the experimental condition. Spectra for the radial probability distributions of responses to the BF, AF, BM, AM faces are superimposed in (b). Given 20 items for each set of faces, this plot produces a distribution centered on 4.32 bits. In (c), the
  data for four categories of faces are plotted for one individual.
 manifold, using data from six subjects toward the same 20 BM faces (F1–F20) for increasing viewing time (data are shown for approach only). For the six approach graphs shown, the x-axis represents the 20 faces in an experimental condition (i.e. BF, AF, BM, AM), and the y-axis represents the number of keypresses toward that face picture. The Shannon entropy was computed using data in this format (see Methods, Analyses, Descriptive Statistical Measures). To schematize the balance of approach
  and avoidance
  , one might imagine a matching of graphs #1 with #6, #2 with #5, and #3 with #4, where one graph represents the keypress responses for approach
  and the other avoidance
  . For the purposes of illustration, we assigned zero values here to
  in sub-figure #6. For each sub-figure (#1–6) above and to the right of the
  manifold, data has been auto-scaled to optimize the pattern display. Overall, this graph represents relative approach or avoidance bias along the polar angle, whereas the extent of indifference/conflict an individual feels toward an experimental condition (i.e. BF, AF, BM, or AM) is distributed in radial fashion from the origin.
 boundary envelope is shown for BF, AF, BM, AM faces in 77 healthy control subjects. The envelope can be fit well either via a logarithmic function or a power function, over the range of keypress responses. As a power function, this envelope has a similar structure to the value function in prospect theory (b). When approach behavior (green points) and avoidance behavior (red points) are plotted together (c), one can readily observe the steeper trajectory of the envelope for avoidance responses, which in prospect theory is interpreted as “loss aversion”. With transformation of the axes (d), both the
  envelope and
  envelope show power law scaling.
 and
and  plots, superimposed on the fits for the other individuals in the cohort. With the same log transformation of axes performed for group data, one observes in each individual the signature of a power law. Here, the data for one individual is highlighted (b) above the graphs in lighter colors for the rest of the subjects. It is important to note that the structure of these individual plots is consistent with the respective boundary envelopes for group data. Interpreting rank order of experimental conditions on these
  graphs depends on how one frames the measurement of relative position, (c). If one frames the ordering of experimental conditions by either axis (dotted blue lines for x-axis, dotted red lines for y-axis), one observes different relative orderings. A third ordering is possible if one frames the positioning relative to the power function fit for
  (light green line), which calibrates the pattern of responses across items in an experimental condition (H) to the mean intensity of responses (K).
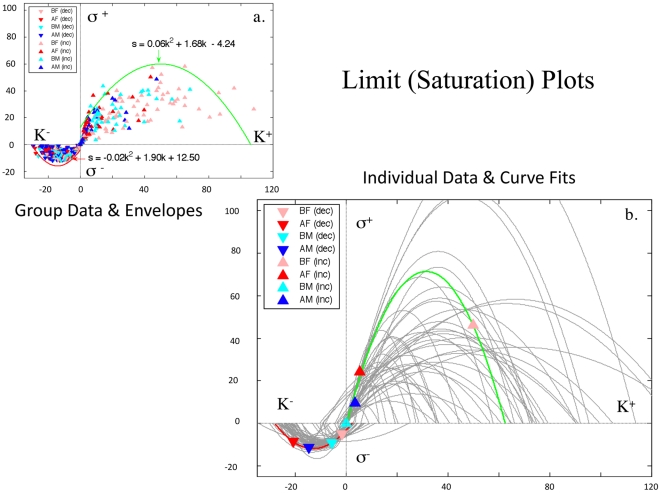
 , and the left side of the approach data distribution for
  . Most telling are the individual data, where quadratic fits are also observed for each of the 77 individual data sets with the BF, AF, BM, AM data (b). A similar mathematical structure is observed in individual graphs with the BF, AF, BM, AM faces, albeit with different fitting parameters for each of the 77 subjects. These patterns are similar to those reported for ensemble averages of mIPSCs for synaptic GABAA channels by De Koninck & Mody .
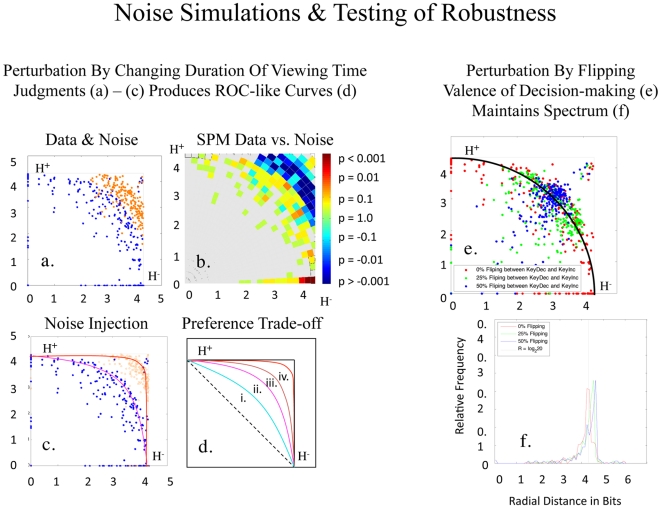
 manifold as one goes from 0% flipping to 50% flipping. With 60% to 100% flipping one observes the manifold being stretched back out along its central tendency (i.e., the black line; data not shown). As one goes from 0% to 100% flipping, one effectively reverses the manifold so that it is rotated along the radius line of 45 degrees. In (f), we see that the radial spectra of the Pflip analysis are superimposed and similar across flipping perturbations. The
  manifold is thus robust to perturbation of the decision-making.
 data (red linear fits) and the
  data (green linear fits) show power law scaling for the individuals in the first and second experiments with the IAPS stimuli. Saturation plots for the same individuals are shown in (c) & (d), where quadratic fits for
  are shown in red, and for
  are shown in green.
 plot is shown in (a). Their value function,
  and
and  , is shown in (b), and with log-transformation of K in (c). Note the tightness of the fitted functions in (b) and (c). Tight quadratic fitting is further noted for the saturation function in (d), for both
  and
and  . Details regarding these fits across the entire cohort of subjects undergoing testing with the IAPS stimuli, can be found in Tables 4 and 5. Note the similar sets of behavioral patterns in this figure to those shown in Figures 2–
6.
. Details regarding these fits across the entire cohort of subjects undergoing testing with the IAPS stimuli, can be found in Tables 4 and 5. Note the similar sets of behavioral patterns in this figure to those shown in Figures 2–
6.
 across these four stimuli differed between the hungry and satiated states, with an angular offset of 58.92° during the hunger condition, and 40.79° during the satiated condition. This difference of 18.13° quantifies the alliesthesia effect, by which homeostatic state can alter the baseline valuation of goal-objects. For these same subjects, the value function for
  is shown in (b), with the signature of a power law in (c), and approach responses in green and avoidance responses in red. Lastly, the saturation plots for these same subjects are shown in (d), with quadratic fitting of approach responses in green and avoidance responses in red. Color, shape, and open/full coding of the four stimulus types, during hunger or satiation, for approach and avoidance responses, are shown with the same codes in (b)–(d). Details regarding fitting across the cohort of subjects undergoing testing with the food stimuli, can be found in Table 6. Note the similar sets of behavioral patterns in this figure to those shown in Figures 2–
6, 8, and 9.
is shown in (b), with the signature of a power law in (c), and approach responses in green and avoidance responses in red. Lastly, the saturation plots for these same subjects are shown in (d), with quadratic fitting of approach responses in green and avoidance responses in red. Color, shape, and open/full coding of the four stimulus types, during hunger or satiation, for approach and avoidance responses, are shown with the same codes in (b)–(d). Details regarding fitting across the cohort of subjects undergoing testing with the food stimuli, can be found in Table 6. Note the similar sets of behavioral patterns in this figure to those shown in Figures 2–
6, 8, and 9.Similar articles
-
Discrete, recurrent, and scalable patterns in non-operant judgement underlie affective picture ratings.Cogn Process. 2025 May;26(2):257-281. doi: 10.1007/s10339-024-01250-9. Epub 2024 Dec 7. Cogn Process. 2025. PMID: 39644430 Free PMC article.
-
Keypress-Based Musical Preference Is Both Individual and Lawful.Front Neurosci. 2017 May 2;11:136. doi: 10.3389/fnins.2017.00136. eCollection 2017. Front Neurosci. 2017. PMID: 28512395 Free PMC article.
-
Beautiful faces have variable reward value: fMRI and behavioral evidence.Neuron. 2001 Nov 8;32(3):537-51. doi: 10.1016/s0896-6273(01)00491-3. Neuron. 2001. PMID: 11709163
-
Ventral pallidal modulation of aversion processing.Brain Res. 2019 Jun 15;1713:62-69. doi: 10.1016/j.brainres.2018.10.010. Epub 2018 Oct 6. Brain Res. 2019. PMID: 30300634 Review.
-
Motivational effects of opioids: evidence on the role of endorphins in mediating reward or aversion.Pharmacol Biochem Behav. 1985 Nov;23(5):877-81. doi: 10.1016/0091-3057(85)90086-3. Pharmacol Biochem Behav. 1985. PMID: 3909169 Review.
Cited by
-
An MRI method for parcellating the human striatum into matrix and striosome compartments in vivo.Neuroimage. 2022 Feb 1;246:118714. doi: 10.1016/j.neuroimage.2021.118714. Epub 2021 Nov 18. Neuroimage. 2022. PMID: 34800665 Free PMC article.
-
Microstructural abnormalities in subcortical reward circuitry of subjects with major depressive disorder.PLoS One. 2010 Nov 29;5(11):e13945. doi: 10.1371/journal.pone.0013945. PLoS One. 2010. PMID: 21124764 Free PMC article.
-
Invited Frontiers Commentary. Tier Climbing Article: Redefining Neuromarketing as an Integrated Science of Influence.Front Neurosci. 2017 Jan 26;11:22. doi: 10.3389/fnins.2017.00022. eCollection 2017. Front Neurosci. 2017. PMID: 28184186 Free PMC article. No abstract available.
-
A novel approach to anxiety level prediction using small sets of judgment and survey variables.Npj Ment Health Res. 2024 Jun 18;3(1):29. doi: 10.1038/s44184-024-00074-x. Npj Ment Health Res. 2024. PMID: 38890545 Free PMC article.
-
From Affective Experience to Motivated Action: Tracking Reward-Seeking and Punishment-Avoidant Behaviour in Real-Life.PLoS One. 2015 Jun 18;10(6):e0129722. doi: 10.1371/journal.pone.0129722. eCollection 2015. PLoS One. 2015. PMID: 26087323 Free PMC article.
References
-
- Paulus MP. Decision-making dysfunctions in psychiatry–altered homeostatic processing? Science. 2007;318:602–606. - PubMed
-
- Lewin K. A Dynamic Theory of Personality: Selected Papers of Kurt Lewin. New York: McGraw-Hill Inc; 1935. 286
-
- Schneirla TC. An evolutionary and developmental theory of biphasic processes underlying approach and withdrawal. In: Jones MR, editor. Nebraska Symposium on Motivation. Nebraska: University of Nebraska Press; 1959. pp. 1–42.
-
- Warren RP. Preference aversion in mice to bitter substance. Science. 1963;140:808–809. - PubMed
Publication types
MeSH terms
Grants and funding
- P20 DA026002/DA/NIDA NIH HHS/United States
- R01 NS052368/NS/NINDS NIH HHS/United States
- P41 RR014075/RR/NCRR NIH HHS/United States
- NIDA 026104/PHS HHS/United States
- NIDA 14118/PHS HHS/United States
- M01 RR001066/RR/NCRR NIH HHS/United States
- R01 DA014118/DA/NIDA NIH HHS/United States
- R33 DA026104/DA/NIDA NIH HHS/United States
- NINDS 052368/PHS HHS/United States
- NINDS 34189/PHS HHS/United States
- R01 DA027804/DA/NIDA NIH HHS/United States
- NIDA 026002/PHS HHS/United States
- P41RR14075/RR/NCRR NIH HHS/United States
LinkOut - more resources
Full Text Sources
