. 2010 Jun 1;5(6):e10829.
doi: 10.1371/journal.pone.0010829.

W-curve alignments for HIV-1 genomic comparisons

Affiliations

W-curve alignments for HIV-1 genomic comparisons

Douglas J Cork et al. PLoS One. .

Abstract

Background: The W-curve was originally developed as a graphical visualization technique for viewing DNA and RNA sequences. Its ability to render features of DNA also makes it suitable for computational studies. Its main advantage in this area is utilizing a single-pass algorithm for comparing the sequences. Avoiding recursion during sequence alignments offers advantages for speed and in-process resources. The graphical technique also allows for multiple models of comparison to be used depending on the nucleotide patterns embedded in similar whole genomic sequences. The W-curve approach allows us to compare large numbers of samples quickly.

Method: We are currently tuning the algorithm to accommodate quirks specific to HIV-1 genomic sequences so that it can be used to aid in diagnostic and vaccine efforts. Tracking the molecular evolution of the virus has been greatly hampered by gap associated problems predominantly embedded within the envelope gene of the virus. Gaps and hypermutation of the virus slow conventional string based alignments of the whole genome. This paper describes the W-curve algorithm itself, and how we have adapted it for comparison of similar HIV-1 genomes. A treebuilding method is developed with the W-curve that utilizes a novel Cylindrical Coordinate distance method and gap analysis method. HIV-1 C2-V5 env sequence regions from a Mother/Infant cohort study are used in the comparison.

Findings: The output distance matrix and neighbor results produced by the W-curve are functionally equivalent to those from Clustal for C2-V5 sequences in the mother/infant pairs infected with CRF01_AE.

Conclusions: Significant potential exists for utilizing this method in place of conventional string based alignment of HIV-1 genomes, such as Clustal X. With W-curve heuristic alignment, it may be possible to obtain clinically useful results in a short time-short enough to affect clinical choices for acute treatment. A description of the W-curve generation process, including a comparison technique of aligning extremes of the curves to effectively phase-shift them past the HIV-1 gap problem, is presented. Besides yielding similar neighbor-joining phenogram topologies, most Mother and Infant C2-V5 sequences in the cohort pairs geometrically map closest to each other, indicating that W-curve heuristics overcame any gap problem.


Conflict of interest statement

Competing Interests: The authors have declared that no competing interests exist.

Figures

Figure 1
Figure 1. W-curve nucleotide coordinate positions (left) and W-curve projection of each nucleotide (right).
The W-curve is generated using a square centered at the origin with corners on the axes (left). Each moving point moves halfway from a starting point P to P' halfway to the corner for the next base in sequence (right). The numbers iterate within the square as follows: P'(T) = [(Px+1)/2, (Py)/2]; P'(A) = [(Px)/2, (Py+1)/2]; P'(G) = [(Px–1)/2], (Py)/2]; P'(C) = [(Px)/2, (Py–1)/2]
Figure 2
Figure 2. Autoregression characteristics of the W-curve.
Two sequences are shown, one in green one in blue. The sequences differ at base 3, which causes the curves to diverge. They converge again by base number 7.
Figure 3
Figure 3. W-curves of a whole HIV-1 genome (A) and embedded pol gene sequence (B, C).
A W-curve of an entire genome of HIV-1 01TH.OUR6091 (Accession number AY358040 is shown in panel A. Panel B shows a “zoomed in” projection of pol gene HIV-1 99TH.OUR1991 (Accession number AY358039) with respect to base pair position in the whole genome. Panel C shows the same pol sequence extracted from the fasta file and renumbered with respect to base pair position. Sequences can be input into one of two graphical packages for the W-curve existing on the internet (10, 11).
Figure 4
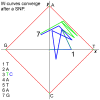
Figure 4. Autoregression in the W-curve after a gap inserted into sequences.
The gap (green, right panel) offsets the matching portion of the right curve by seven bases. After three bases for the curves to converge (shown in blue) the curves converge again. Comparing bases 1204 and 1211 (gap + convergence window) will show the curves aligning.
Figure 5
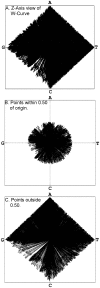
Figure 5. W-curve Z-Axis view of complete HIV-1 Genome showing all points (A), points near origin with radius <.5 (B) and further out, with radius >.5 (C).
The last group of points (C) is used to re-align the curves after a gap. CG dinucleotide deficiencies are seen in B and C.
Figure 6
Figure 6. The W-curve for “CG” showing both Cartesian & Cylindrical notation for the points.
The curve is shown in blue, layout lines indicating the X-Y locations and line for half-distance rule between the points for C & G are shown in red.
Figure 7
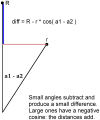
Figure 7. Difference measure for W-curves stored in Cylindrical notation.
Subtracting the projection of the smaller radius onto the larger one smooths out small differences after the curves have largely converged. For small angles (shown) the projection is subtracted and produces a small difference. As the angle increases the projection becomes small; points in opposite quadrants have obtuse angles with a negative cosine, adding the projection onto the larger radius.
Figure 8
Figure 8. Neighbor-joining string-based phylogenetic tree vs. W-curve-based tree.
Envelop C2-V5 from the 051 mother/infant pair grouping from a study previously conducted in Thailand . The string based tree at the left compares the infant sequences to the maternal viruses from different compartments and CM240 as a reference subtype: (I) infant peripheral blood mononuclear cell (PBMC) DNA-derived sequences; M, maternal PBMC DNA-derived sequences; P, maternal plasma-derived sequences; CW, cervical secretion-derived sequences. Numbers at the nodes represent the maximum parsimony bootstrap value. Branch lengths between the sequences are proportionate to the scale bar and indicate the number of mutations per base position per unit time. The tree at the right is the W-curve-based tree. Note the similarity in the clustering patterns. The remaining phenograms are available in the supporting data for this paper .
Figure 9
Figure 9. Linked List and Skip Chain.
Points on the W-curve are stored as nodes in a linked list, using either Cylindrical (shown) or Cartesian notation. The skip chain for each node references the next node with a radius greater than 0.50, giving direct access to nodes used in re-aligning the curves after a gap or indel.
Figure 10
Figure 10. Building a fragment library.
Panels A, B, C, D describe the process of extracting curve fragments. Autoregression allows re-use of the curve fragments for comparisons between curves. Starting with the W-curve for a genome or gene (A), regions corresponding to the sequences of interest are found (B) and the remainder of the curve dropped (C), leaving a set of smaller curves (D). The set of curve fragments can be used to search for a list of regions in or score only part of a gene. For example, scoring only the conserved regions of gp120 may prove more effective for generating phenograms than using the entire gp120 sequence or env gene.

References

    1. Wu D, Roberge J, Cork DJ, Nguyen BG, Grace T. 1993;33:308–315. Computer visualization of long genomic sequences, in Visualization 1993, IEEE Press, New York City, New York, CP.
    1. Jeffrey HJ. Chaos game representation of gene structure. Nucleic Acids Res. 1990;18:2163–2170. - PMC - PubMed
    1. Almeida JS, Carrico JA, Maretzek A, Noble PA, Fletcher M. Analysis of genomic sequences by chaos game representation. Bioinformatics. 2001;17(5):429–437. - PubMed
    1. Huang G, Liao B, Li Y, Yu Y. Similarity studies of DNA sequences based on a new 2D graphical representation. Biophysical Chem. 2009;143:55–59. - PubMed
    1. Cork DJ, Marland E, Zmuda J, Hutch TB. Valafar F, editor. Achieving Congruency of Phylogenetic Trees Generated by W-curves of Genomic Sequences. 2002. pp. 32–40. Techniques in Bioinformatics and Medical Informatics. Part I. Bioinformatics. Ann. N. Y. Acad. Sci. - PubMed

Publication types