. 2010 Aug 1;518(15):2952-77.
doi: 10.1002/cne.22373.

Nuclear-cytoplasmic localization of acetyl coenzyme a synthetase-1 in the rat brain

Affiliations

Nuclear-cytoplasmic localization of acetyl coenzyme a synthetase-1 in the rat brain

Prasanth S Ariyannur et al. J Comp Neurol. .

Abstract

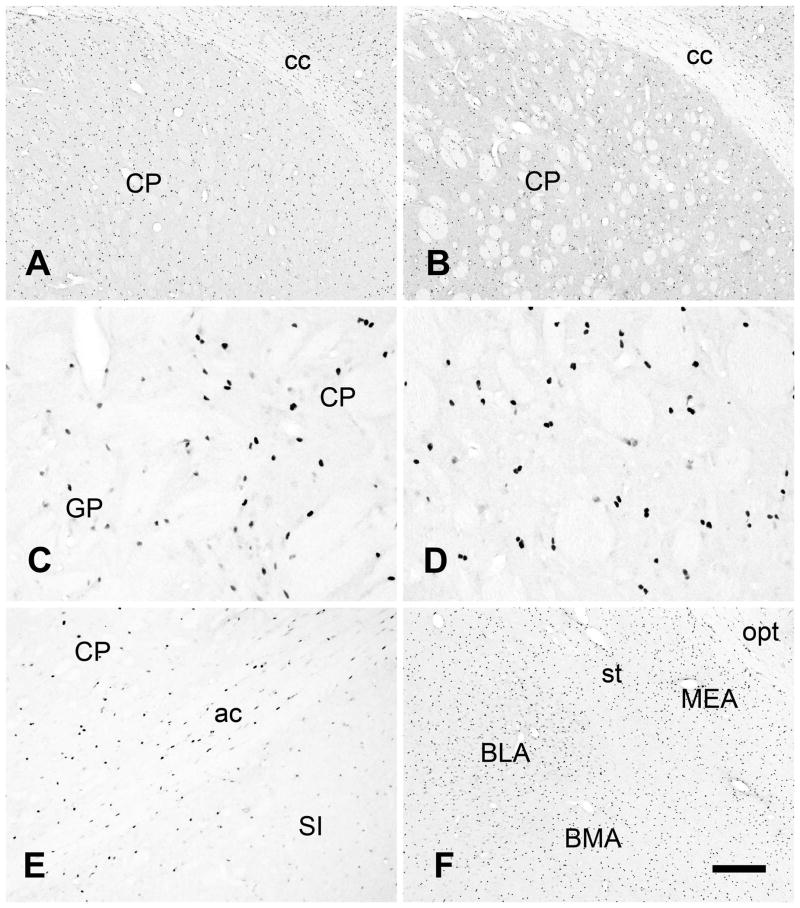
Acetyl coenzyme A synthetase-1 (AceCS1) catalyzes the synthesis of acetyl coenzyme A from acetate and coenzyme A and is thought to play diverse roles ranging from fatty acid synthesis to gene regulation. By using an affinity-purified antibody generated against an 18-mer peptide sequence of AceCS1 and a polyclonal antibody directed against recombinant AceCS1 protein, we examined the expression of AceCS1 in the rat brain. AceCS1 immunoreactivity in the adult rat brain was present predominantly in cell nuclei, with only light to moderate cytoplasmic staining in some neurons, axons, and oligodendrocytes. Some nonneuronal cell nuclei were very strongly immunoreactive, including those of some oligodendrocytes, whereas neuronal nuclei ranged from unstained to moderately stained. Both antibodies stained some neuronal cell bodies and axons, especially in the hindbrain. AceCS1 immunoreactivity was stronger and more widespread in the brains of 18-day-old rats than in adults, with increased expression in oligodendrocytes and neurons, including cortical pyramidal cells. Expression of AceCS1 was substantially up-regulated in neurons throughout the brain after controlled cortical impact injury. The strong AceCS1 expression observed in the nuclei of CNS cells during brain development and after injury is consistent with a role in nuclear histone acetylation and therefore the regulation of chromatin structure and gene expression. The cytoplasmic staining observed in some oligodendrocytes, especially during postnatal brain development, suggests an additional role in CNS lipid synthesis and myelination. Neuronal and axonal localization implicates AceCS1 in cytoplasmic acetylation reactions in some neurons.


Figures

Figure 1
Figure 1
Western blots depicting anti-peptide AceCS1 antibody specificity before and after affinity purification, and the immunoreactivity with the crude antisera directed against full-length recombinant AceCS1 protein. Both antibodies reacted with a doublet band at approximately 76kD. The anti-peptide antibody also reacted with several minor bands which were mostly removed by affinity purification.
Figure 2
Figure 2
AceCS1 immunoprecipitation studies showed that the affinity purified anti-peptide antibody removed most of the AceCS1 enzymatic activity from brain homogenates. Less than 4% of the activity in the control samples was present in the samples immunoprecipitated with the anti-peptide AceCS1 antibody.
Figure 3
Figure 3
AceCS1 anti-peptide antibody colocalization with the oligodendrocyte marker CC1 in the corpus callosum using the anti-peptide AceCS1 antibodies. A) CC1 immunoreactivity (red), B) AceCS1 immunoreactivity (green), C) DAPI florescence showing cell nuclei (blue) and D) the merged image. A magenta color shows colocalization of AceCS1 with cell nuclei, whereas a yellow to white color shows colocalization of AceCS1 with both cell nuclei and CC1 (arrows show the same cell in all 4 panels). Bar in panel D = 25 μm.
Figure 4
Figure 4
AceCS1 anti-peptide antibody colocalization with oligodendrocyte marker CC1 in the fimbria of the hippocampus. Affinity purified anti-peptide antibodies were used. A) CC1 immunoreactivity with red fluorochrome, B) AceCS1 immunoreactivity with green fluorochrome, C) DAPI florescence showing cell nuclei in blue and D) the merged image. A magenta color shows colocalization of AceCS1 with cell nuclei, whereas a yellow to white color shows colocalization of AceCS1 with both cell nuclei and CC1. Arrows indicate the same cells in the 4 panels. Bar in D = 25 μm.
Figure 5
Figure 5
Anti-peptide AceCS1 antibody colocalization with oligodendrocyte marker CC1 in layer IV of temporal cortex. The expression in this area colocalized with both CC1 and DAPI, indicating that AceCS1 was present in the nuclei of oligodendrocytes. Arrows show fluorescence with all three markers, and the colocalization in the merged image. A) CC1 immunoreactivity, B) AceCS1 immunoreactivity, C) DAPI florescence showing cell nuclei, D) merged image (arrow indicates the same cell in each image). Bar = approx. 25 μm.
Figure 6
Figure 6
AceCS1 anti-recombinant protein antibody colocalization with the astrocyte marker GFAP in layer VI of neocortex (A-D) and at the brain surface including glia limitans (E-H). AceCS1 expression (red) was colocalized with DAPI (blue), resulting in a magenta color (arrows in panels D and H), indicating that AceCS1 was present in the nuclei of cells. It was difficult to determine if GFAP (green) and AceCS1 were colocalized in the same cells due to non-overlapping distributions in astrocyte processes and cell nuclei respectively. However, the pattern of immunoreactivities for the two markers was consistent with localization AceCS1 in the nuclei of some astrocytes.
Figure 7
Figure 7
AceCS1 antibody blocking studies. AceCS1 immunoreactivity was blocked by pre-incubation of the anti-peptide antibodies (1:1,300 dilution) with10 μg/ml of the immunizing peptide. For example, AceCS1-IR in the CA3 region of hippocampus (A) was completely blocked by pre-incubating the anti-peptide antibodies with the immunizing peptide (B). AceCS1-IR with the anti-recombinant protein antisera (diluted 1:5,000) was blocked in the CA3 region of hippocampus from the same rat by pre-incubating the anti-recombinant antisera with 10 μg/ml of the recombinant protein used for immunizations (C and D). Bar in D = 120 μm.
Figure 8
Figure 8
AceCS1-IR in forebrain fiber tracts. Some oligodendrocyte nuclei were strongly immunoreactive for AceCS1 in all fiber tracts, including in the corpus callosum (cc; A and F), internal capsule (int; B), optic tracts (opt; C), anterior commissure (ac; D), lateral olfactory tract (lot; E), fimbria (fim; F) and ventral hippocampal commissure (vhc; F). Light cytoplasmic staining was observed in some oligodendrocytes, but most were unstained. Ependymal cell nuclei, for example those around the third ventricle (III), were also variably stained for AceCS1 (D). Abbreviation: SFO: subfornical organ. Images A-D were acquired with DIC optics (images adjusted for evenness of illumination). All images from tissue stained with anti-recombinant protein AceCS1 antibodies; bar in F = 60 μm A-D, 300 μm E and F.
Figure 9
Figure 9
Neocortex. AceCS1 was expressed in all layers of neocortex (A), as well as in underlying structures including the corpus callosum (cc) and striatum (caudate/putamen; CP) (B). The most strongly immunoreactive elements were cellular nuclei. In general, neuronal nuclei, such as motor neurons in layer V of cortex, tended to express lower levels of AceCS1 (arrows) than was observed in small non-neuronal cells, and the staining was unevenly distributed within the nuclei (C). The small, strongly immunoreactive cell nuclei were often observed in closely associated pairs, such as in layer IV of neocortex (D). Cell nuclei in layer I of neocortex were numerous and strongly stained at the surface, but less numerous and less strongly immunoreactive in the remainder of layer I (E). Unlike the anti-protein AceCS1 antibody, the antibody generated against the peptide sequence stained more neurons (arrow in 8F), and stained puncta in areas such as layers II and III of neocortex (F). Images A – E = protein antibody, image F = affinity purified peptide antibody; bar in F = 300 μm A and B, 30 μm in C, E and F, and 20 μm D.
Figure 10
Figure 10
Hippocampus. The anti-recombinant AceCS1 protein antibodies stained cellular nuclei in all layers of hippocampus. The dorsal hippocampus is shown in A, and the caudal hippocampus is shown at low magnification in B. The immunoreactive cell nuclei were most concentrated in CA3 and the border between the granule cell (sg) and polymorph (po) layers (F). The anti-peptide AceCS1 antibodies stained fewer nuclei, but also stained scattered interneurons and numerous puncta which were not seen with the protein antibody (compare images A and C; images D and E are successive enlargements of the area shown in C). Abbreviations: cc = corpus callosum, DG = dentate gyrus, sg = granule cell layer, po = polymorph layer, slm = stratum lacunosum moleculare, so = stratum oriens, sp = stratum pyramidal CA3, sr = stratum radiatum. Images A, B and F = protein antibody, images C, D and E = affinity purified peptide antibody; bar in F = 300 μm A and C, 1 mm B, 120 μm D and F, 30 μm E.
Figure 11
Figure 11
Telencephalic nuclei. Cell nuclei were immunoreactive throughout the dorsal striatum (caudate-putamen; CP) using both antibodies (A and B). Fewer immunoreactive cell nuclei were observed in the globus pallidus (GP) than in the caudate-putamen, and the stained nuclei in the globus pallidus were often less strongly immunoreactive than those in the caudate-putamen (C). As in neocortex, immunoreactive cell nuclei were often seen in closely associated pairs in the caudate-putamen (D). Structures immediately ventral to the anterior commissure (ac) such as the substantia innominata (SI) had relatively sparse AceCS1-IR (E). The amygdala contained many immunoreactive cell nuclei (F). Abbreviations: ac = anterior commissure, BLA = basolateral amygdalar nucleus, BMA = basomedial amygdalar nucleus, cc = corpus callosum, MEA = medial amygdalar nucleus, opt = optic chiasm, st = stria terminalis. Images A, C, D, E and F = protein antibody, image B = affinity purified peptide antibody; bar in F = 300 μm A, B and F, 60 μm C and D, 120 μm E.
Figure 12
Figure 12
Septum, diagonal band and piriform cortex. Immunoreactivity patterns with the protein (A) and peptide (B) antibodies were similar in the septum, except for greater neuronal staining with the anti-peptide antibody (B). The same pattern was observed in the nucleus of the diagonal band, where the protein antibody stained predominantly cell nuclei (C), and the peptide antibody stained cell nuclei and a subpopulation of neurons (D). In piriform cortex both antibodies stained cell nuclei (E and F), and the peptide antibody stained puncta on the surface of neurons as well (F). Abbreviations: LS = lateral septum, MS = medial septum. Images A, C and E = protein antibody, images B, D and F = affinity purified peptide antibody; bar in F = 300 μm A, B and 60 μm C – D.
Figure 13
Figure 13
Midbrain. Numerous immunoreactive cell nuclei were present in the periaqueductal grey (A; PAG), ventral tegmental area (VTA) and medial mammillary nucleus (B; MM). The reticular portion of the substantia nigra (SNr) had relatively few immunoreactive cell nuclei, whereas a greater number of stained nuclei was present in the compact portion (SNc; C and D). The strongest neuronal staining in midbrain was observed in the mesencephalic trigeminal nucleus where the large sensory neurons expressed AceCS1 in their cytoplasm, nuclei and fibers (E and F). In some of these sensory neurons expression was particularly strong at the periphery of the cell nuclei, or in the perinuclear region (F). Abbreviations: LC = locus coeruleus, MM = medial mammillary nucleus, SNc = substantia nigra compact region, SNr = substantia nigra reticular portion, VTA = ventral tegmental area. All images are from AceCS1 protein antibody stained sections; bar in F = 300 μm A, B and C, 60 μm D and E, 30 μm F.
Figure 14
Figure 14
Cerebellum and pons. Low magnification image of cerebellar cortex showing light to moderate immunoreactivity in all layers (A). Immunoreactive cell nuclei could be seen in the white matter (wm) granule cell (Gr) and molecular (Mo) layers (B and C). Purkinje cells ranged from unstained to moderately stained, and most immunoreactive Purkinje cells had stronger staining in their nuclei than in their cytoplasm (arrows in B and C). A slice through the Purkinje cell layer at high magnification shows the variability in nuclear AceCS1-IR (D). The pontine gray was notable for the high density of immunoreactive cell nuclei (E), as well as light to moderate immunoreactivity in many neurons (F). Abbreviations: cst = corticospinal tract, Gr = granule cell layer, mcp = middle cerebellar peduncle, Mo = molecular layer, PG = pontine gray. Wm = white matter. All images are from AceCS1 protein antibody stained sections, bar in F = 300 μm A and E, 120 μm B, 60 μm C and F and 30 μm D.
Figure 15
Figure 15
Brainstem. Similar to the sensory neurons in the mesencephalic trigeminal nucleus (see Fig 13), the sensory ganglion cells of the vestibular ganglia (GvVIII) were moderately to strongly immunoreactive for AceCS1 (A and B). Immunoreactivity in these neurons was present in their cytoplasm, nuclei and fibers, and was variable between compartments. Some of these sensory ganglion cells had the highest levels of cytoplasmic staining observed in the brain (B). Oligodendrocytes were immunoreactive in their nuclei and cytoplasm in many brainstem fiber tracts and nerves, including the seventh nerve (VIIn; A) and eighth nerve (C). Some large reticular neurons were lightly to moderately immunoreactive, typically with higher immunoreactivity in their cytoplasm than in their nuclei (D and E). Staining in some of these large neurons was particularly strong in the perinuclear region. Many axons throughout the brainstem were lightly to moderately immunoreactive for AceCS1, such as the fibers of the medial longitudinal fasciculus shown cut on end in (F). All images are from AceCS1 protein antibody stained sections. Abbreviations: GvVIII = vestibular ganglion, GRN = gigantocellular reticular nucleus, tsp = tectospinal tract, VIIn = 7th cranial nerve, VCO = ventral cochlear nucleus. Bar in F = approx. 300 μm A, 30 μm B-D and F and 60 μm E.
Figure 16
Figure 16
AceCS1 expression in18 day old rat brain. AceCS1 was expressed much more strongly in the brain during postnatal brain development, with numerous neurons in all cortical layers expressing AceCS1 (A). Oligodendrocytes were also strongly stained, including those in the corpus callosum (cc) and fimbria (fim) (B and C). Most neurons were moderately to strongly immunoreactive, and expression was stronger in their nuclei than their cytoplasm, for example in the CA3 region of hippocampus (D). Oligodendrocytes were strongly stained at the anterior pole (forceps) of the corpus callosum (E). Moderate immunoreactivity was also seen in some neuroepithelial cells such as those around the rhinocele (RC) in the frontal pole (F). All images are from AceCS1 recombinant protein antibody stained sections. Bar in F = 300 μm A and B, 60 μm C – F.
Figure 17
Figure 17
AceCS1-IR in the rat brain 3 days after experimental unilateral controlled cortical impact (CCI) injury. Neocortex in a control rat (A) is compared with the uninjured (contralateral) cortex in a rat 3 days after unilateral CCI injury (B). Strong upregulation of AceCS1-IR occurred in neuronal cell nuclei, especially in larger pyramidal neurons. In uninjured rats pyramidal cell nuclei were usually only very lightly immunoreactive (arrow in C) whereas after injury, immunoreactivity was very strong in pyramidal cell nuclei (arrow in D). The same upregulation of nuclear expression was observed in the hippocampus. For example, in uninjured adult rats, CA3 pyramidal neurons had light to moderate AceCS1-IR in their nuclei (E), but in injured rats, expression in the nuclei of these neurons was strongly upregulated (F). AceCS1-IR was also observed in capillaries after CCI injury (arrow in F). All images are from AceCS1 recombinant protein antibody stained sections. DIC optics; bar in F = 60 μm A and B, 30 μm C – F.

References

    1. Ariyannur PS, Madhavarao CN, Namboodiri AM. N-acetylaspartate synthesis in the brain: Mitochondria vs. microsomes. Brain Res. 2008;1227:34–41. - PubMed
    1. Arun P, Ariyannur PS, Moffett JR, Xing G, Hamilton K, Grunberg NE, Ives JA, Namboodiri AM. Metabolic Acetate Therapy for the Treatment of Traumatic Brain Injury. J Neurotrauma. 2010;27:293–8. - PMC - PubMed
    1. Arun P, Moffett JR, Namboodiri AM. Evidence for mitochondrial and cytoplasmic N-acetylaspartate synthesis in SH-SY5Y neuroblastoma cells. Neurochem Int. 2009;55(4):219–25. - PubMed
    1. Baurle J, Bruning G, Schemann M, Nishiike S, Guldin WO. Co-localization of glutamate, choline acetyltransferase and glycine in the mammalian vestibular ganglion and periphery. Neuroreport. 1999;10(17):3517–21. - PubMed
    1. Benjamin AM, Quastel JH. Acetylcholine synthesis in synaptosomes: mode of transfer of mitochondrial acetyl coenzyme A. Science. 1981;213(4515):1495–7. - PubMed

Publication types

MeSH terms