. 2010 Aug 1;518(15):3130-48.
doi: 10.1002/cne.22387.

beta-Endorphin expression in the mouse retina

Affiliations

beta-Endorphin expression in the mouse retina

Shannon K Gallagher et al. J Comp Neurol. .

Abstract

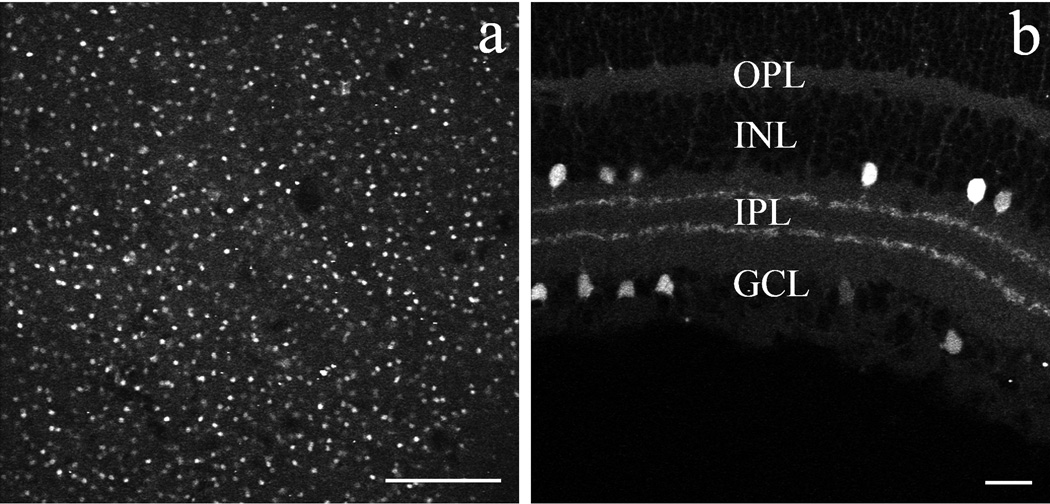
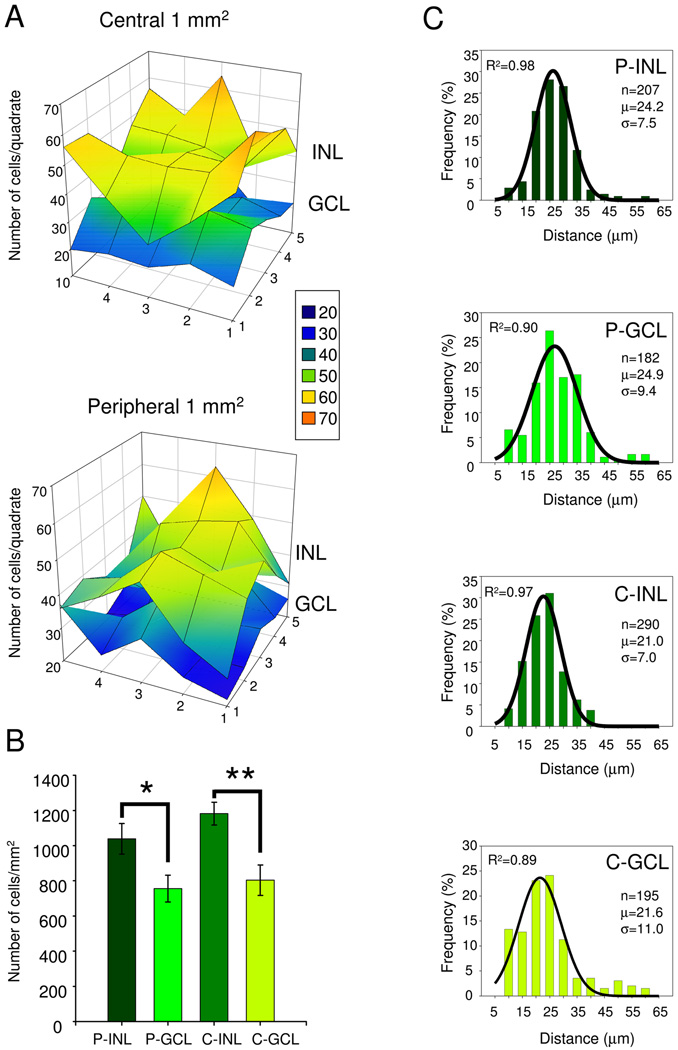
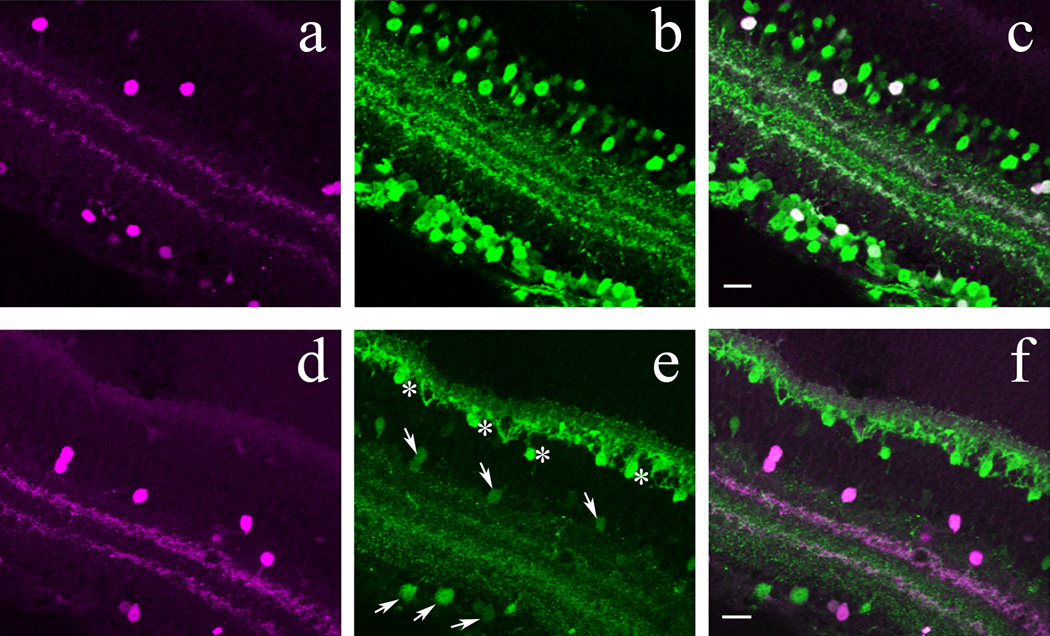
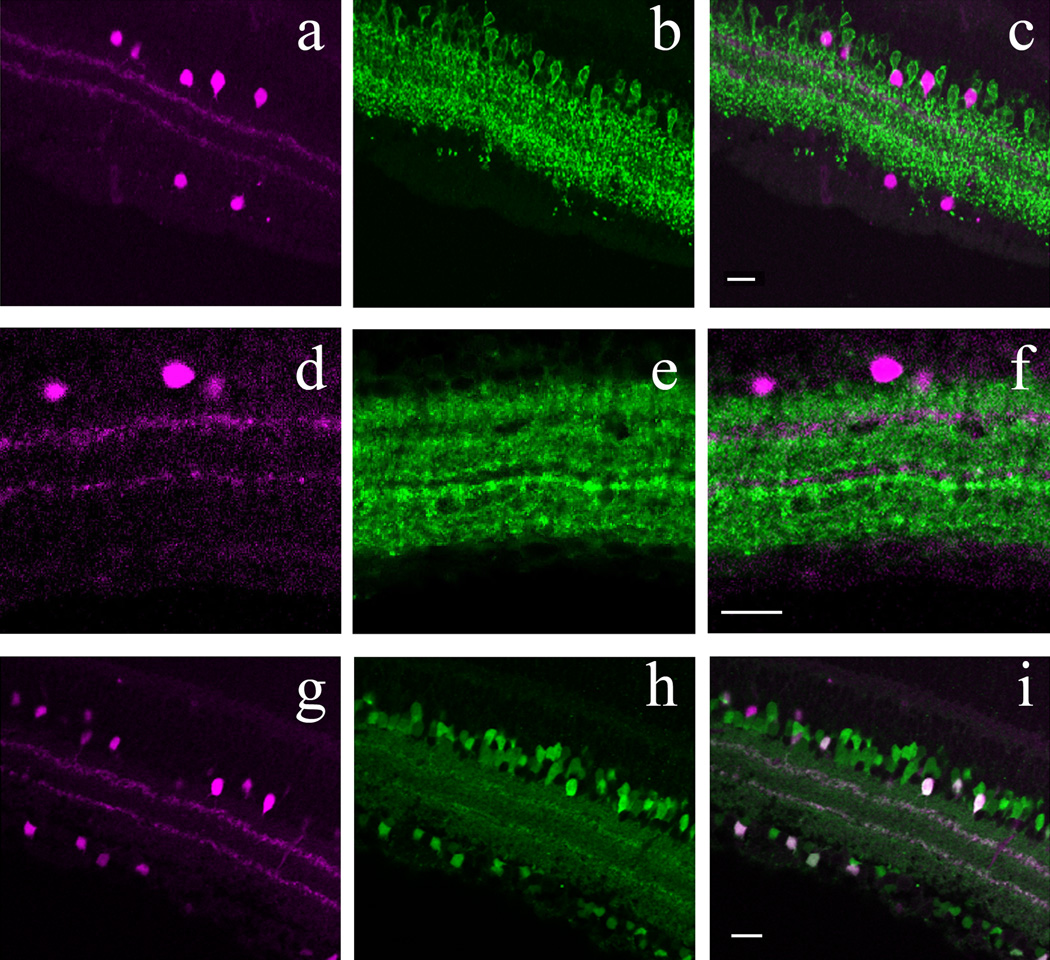
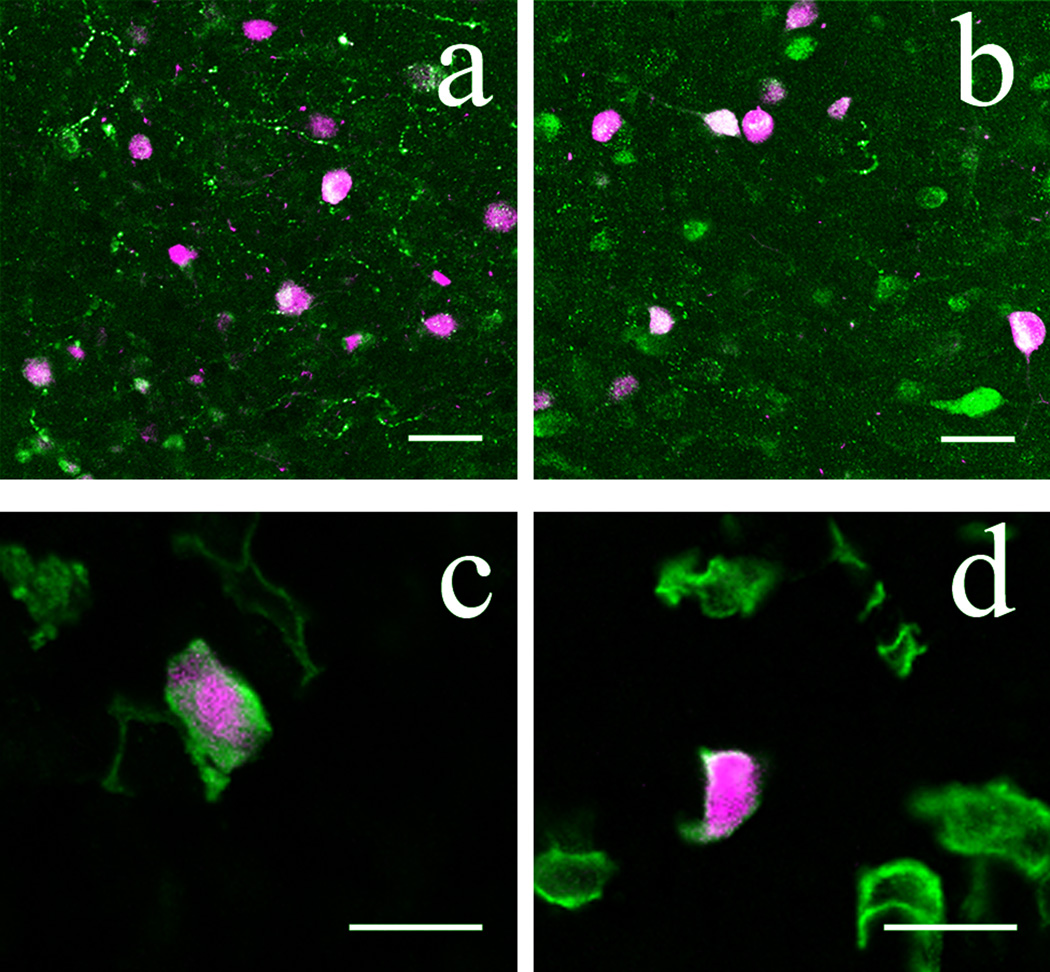
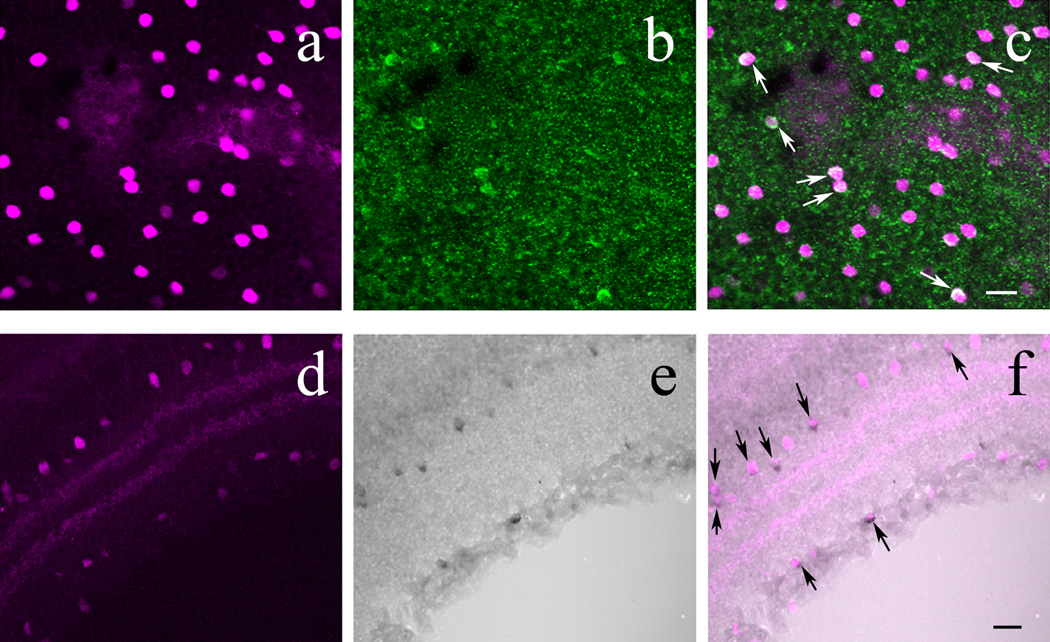
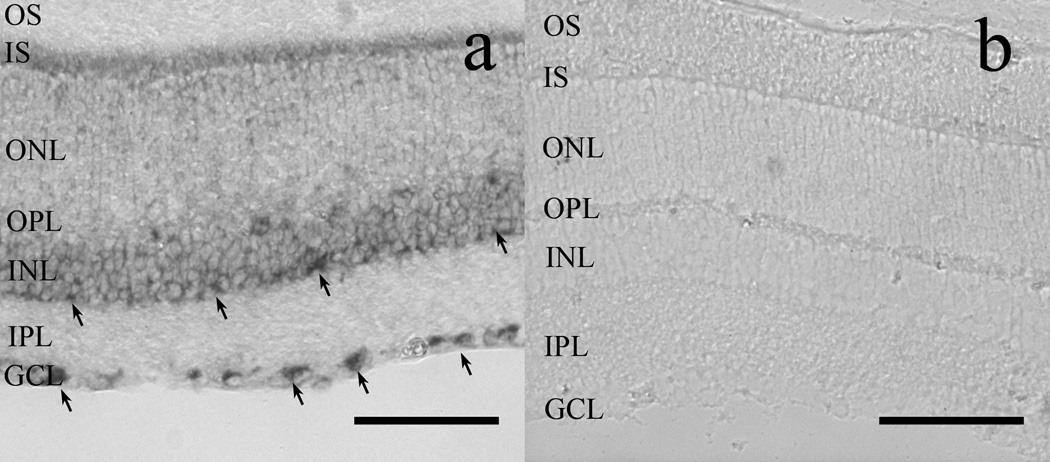
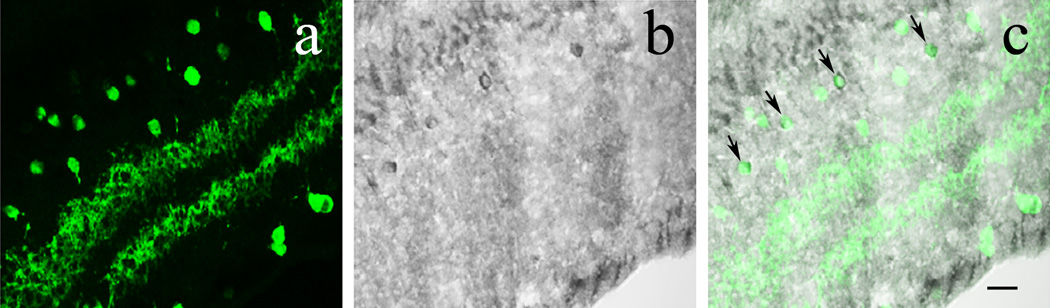
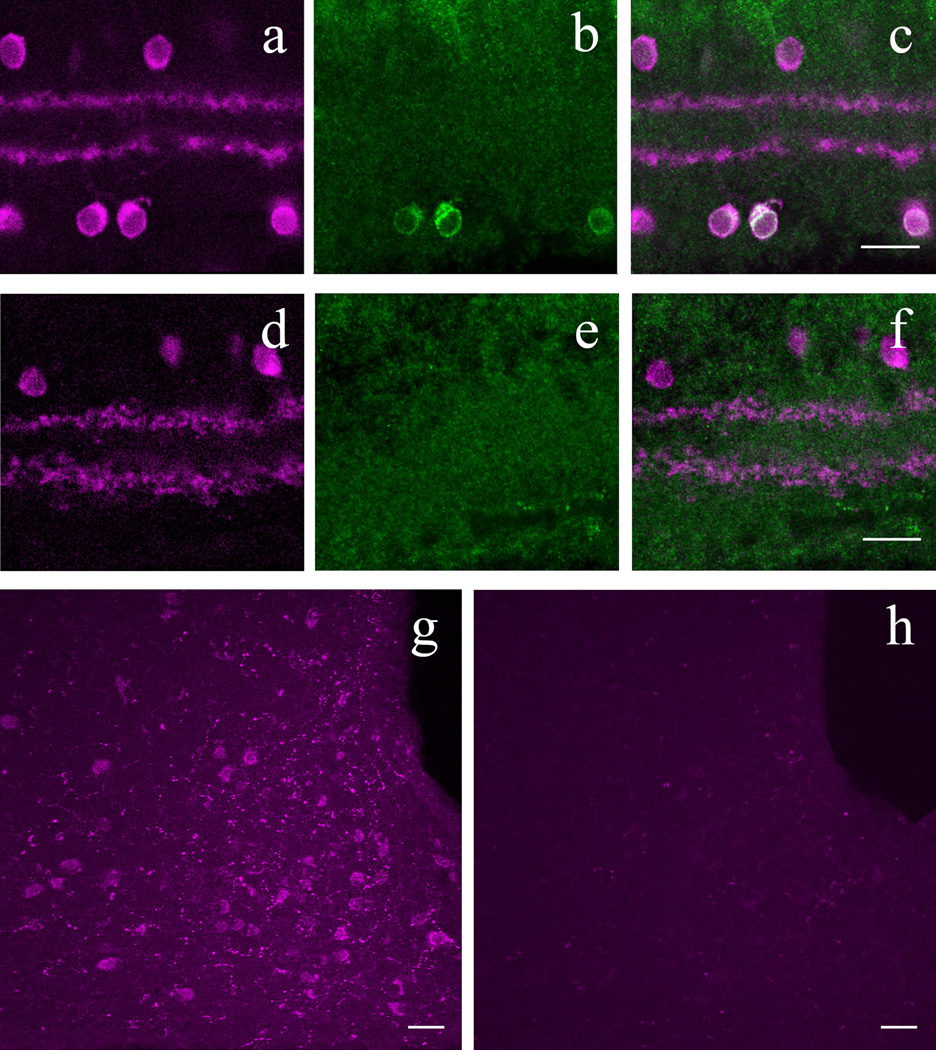
Evidence showing expression of endogenous opioids in the mammalian retina is sparse. In the present study we examined a transgenic mouse line expressing an obligate dimerized form of Discosoma red fluorescent protein (DsRed) under the control of the pro-opiomelanocortin promoter and distal upstream regulatory elements to assess whether pro-opiomelanocortin peptide (POMC), and its opioid cleavage product, beta-endorphin, are expressed in the mouse retina. Using double label immunohistochemistry we found that DsRed fluorescence was restricted to a subset of GAD-67-positive cholinergic amacrine cells of both orthotopic and displaced subtypes. About 50% of cholinergic amacrine cells colocalized DsRed and a large fraction of DsRed-expressing amacrine cells was positive for beta-endorphin immunostaining, whereas beta-endorphin-immunoreactive neurons were absent in retinas of POMC null mice. Our findings contribute to a growing body of evidence demonstrating that opioid peptides are an integral component of vertebrate retinas, including those of mammals.


Conflict of interest statement

Authors declare no financial conflict of interest.

Figures

Figure 1
Figure 1
DsRed fluorophore expression in the retina of POMC transgenic mice in confocal images of whole-mounted (A) and vertically cryosectioned retinas (B). A: Low-power image of a POMC-DsRed retinal whole-mount focused on the INL, showing fluorescent cell bodies of similar shape, size and distribution; scale bar: 200µm. B: Vertical cryostat section through the POMC-DsRed retina showing bright fluorescent cell bodies of similar shape and size distributed in both the INL and the GCL, with their processes forming two distinct bands within the IPL; scale bar: 20µm.
Figure 2
Figure 2
A: POMC-DsRed+ soma distribution in a single representative retina. Cell body counts were performed in the inner nuclear and ganglion cell layers (INL and GCL, respectively) over a 1 mm2 area compiled from 5×5, adjacent, 200 µm × 200 µm confocal Z-stack images at both the center (C) and at the periphery (P) of the retina. The 3D surface plot shows that despite small differences in the soma counts/quadrate, POMC-DsRed somas were rather evenly distributed in each nuclear layer. However, there are more DsRed+ somas in every INL quadrate than in the corresponding GCL area. The number of total DsRed+ cells/mm2 plotted in this example: C-INL:1198; C-GCL:677; P-INL:1068; P-GCL:715. Inset shows how the number of cells counted in the 200 µm × 200 µm quadrates corresponds to colors used for the surface plot. B: Cumulative data (n=9) showing POMC-DsRed soma distribution, comparing cell counts within nuclear layers in the periphery (P) and center (C) and between inner nuclear and ganglion cell layers of the mouse retina (i.e. P-INL, P-GCL, C-INL and C-GCL, respectively); error bars represent SEM; *: p<0.00001; **:p<0.000009, paired Student’s t-test. C: Histograms of the nearest-neighbor distances at (P) and (C) in both inner nuclear and ganglion cell layers of the mouse retina (i.e. P-INL, P-GCL, C-INL and C-GCL, respectively). Bin size: 5 µm. Absolute numbers of observations/ bin were normalized to the total number of measurements (n). Normalized histograms were fitted with Gaussian distribution functions (solid lines). R2: coefficient of determination; μ: average of nearest-neighbor distances; σ: standard deviation
Figure 3
Figure 3
Calcium-binding proteins in POMC-DsRed+ cells in confocal images of vertical cryostat sections. A, D: POMC-DsRed (magenta) retina showing soma distribution in both the INL and GCL with two bands in the IPL. B: Confocal image illustrating the same region as in A, showing numerous calretinin+ (green) somas in the INL and GCL and three distinct bands within the IPL. C: A merged image of A and B showing colocalization of POMC-DsRed+ and calretinin+ somas, as well as colocalization of POMC-DsRed+ bands with the inner and outer calretinin+ IPL bands. E: Confocal image of the same region as in D, showing calbindin+ (green) somas in two distinct regions of the INL with somas also in the GCL and in three distinct bands in the IPL. The calbindin+ (putative horizontal cell) somas (asterisks) at the outer border of the INL and their projections seen in the OPL were more brightly stained than were somas and processes located in the inner retina (arrows). F: A merged image of D and E showing colocalization of POMC-DsRed+ somas and bands with calbindin+ somas and inner and outer IPL bands. Note, all POMC-DsRed+ somas and bands colocalize with calretinin and calbindin. Scale bar: 20µm.
Figure 4
Figure 4
Inhibitory amacrine cell marker detection in POMC-DsRed cells in confocal images of vertical cryostat sections. A, D: POMC-DsRed (magenta) retina showing soma distribution in both the INL and GCL with two bands in the IPL. B: Image representative of the same region as A, showing GLYT-1 immunolabeling (green) for numerous cell bodies in the INL with projections throughout the IPL. Note the absence of GLYT-1-ir somas in the GCL. C: A merged image of A and B, showing no colocalization of POMC-DsRed+ cell bodies with GLYT-1 immunolabeling. Additionally, although GLYT-1+ projections are broadly distributed within the IPL, they do not colocalize with the two DsRed+ bands. E: Image displaying the same region as in D, showing faint GAD65+ somas (green) in the INL and GCL with widespread projections throughout most of the IPL. Note the two distinct bands characterized by an absence of GAD65+ projections in the IPL. F: A merged image of D and E showing no colocalization of GAD65-ir cell bodies or their projections with the two POMC-DsRed+ bands, which distribute within horizontal spaces in the IPL devoid of GAD65-ir. G: DsRed+ somas (magenta) and projections of a POMC-DsRed / GAD67-EGFP double transgenic mouse. H: Image illustrating the same region as in G, showing GAD67-EGFP+ somas in both the INL and the GCL and two bands within the IPL from their projections. I: A merged image of G and H showing strong colocalization of POMC-DsRed+ cell bodies in both the INL and GCL with GAD67-EGFP+ somas. Furthermore, colocalization of these markers in two IPL bands is also seen. Scale bars: 20µm.
Figure 5
Figure 5
POMC-DsRed transgene colocalizes with the cholinergic amacrine cell marker ChAT in confocal images of retinal whole-mounts (AD–C) and vertical cryostat section (D–E). A: High-power image of a whole-mounted POMC-DsRed (magenta) retina focused on the INL. B: Image illustrating the same region as A, showing numerous ChAT+ soma. C: A merged image of A and B, showing strong colocalization of POMC-DsRed+ cell bodies with ChAT (green). Note that not all ChAT+ somas are POMC-DsRed+. D: Vertical cryostat section through POMC DsRed (magenta) retina showing the distribution of labeled somas in both the INL and GCL and two bands of labeled processes in the IPL. E: Image of the same region as D, showing ChAT-ir cell bodies (green) evenly distributed within the INL and GCL and two distinct ChAT-ir bands in the IPL. F: A merged image of D and E demonstrating strong colocalization of POMC-DsRed+ somas and ChAT+ somas within the INL and GCL with further colocalization within two distinct bands of labeled processes in the IPL. Scale bars: 20µm.
Figure 6
Figure 6
POMC-DsRed+ neurons in the arcuate nucleus and the pituitary show β-endorphin immunoreactivity. A: β-endorphin immunoreactivity (green) was limited to neuronal fibers and showed only weak immunoreactivity in cell bodies of DsRed+ hypothalamic neurons (magenta). B: Inhibiting axonal transport by colchicine increased β-endorphin immunoreactivity in the soma of DsRed+ POMC neurons. In the pituitary, DsRed+ cell (magenta) are immunolabeled for β-endorphin (C) and ACTH (D) (both green) without colchicine treatment. Scale bars: 20µm.
Figure 7
Figure 7
In the retina of POMC-DsRed transgenic mice, a subset of DsRed+ amacrine cells colocalizes β-endorphin. A: High-power image of a whole-mounted POMC-DsRed (magenta) retina focused on the INL. B: Image displaying the same region as A, showing distinct β-endorphin+ cell bodies (green) of similar size and shape. C: A merged image of A and B, showing colocalization of β-endorphin and DsRed expression in somas (white arrows). D: Vertical cryostat section through POMC-DsRed (magenta) retina showing the distribution of labeled somas in both the INL and GCL with two bands in the IPL. E: DAB amplification of cryostat sectioned retinas for visualization of β-endorphin, illustrating the same region as D. Note β-endorphin-ir within somas in both the INL and GCL. F: A merged image of D and E, showing perfect colocalization of β-endorphin+ cell bodies with POMC-DsRed signal (black arrows). Note that not all DsRed+ cells show β-endorphin-ir. Scale bars: 20µm.
Figure 8
Figure 8
In situ hybridization reveals POMC mRNA in the GCL and INL of wild-type mouse retinas (A). Note the dark reaction product obtained with the antisense probe, indicative of POMC mRNA expression in somas located in the GCL and in INL (arrows). (B): The sense probe failed to label any structure in the retina. OS: photoreceptor outer segment layer; IS: photoreceptor inner segment layer; ONL: outer nuclear layer; OPL: outer plexiform layer; INL: inner nuclear layer; IPL: inner plexiform layer; GCL: ganglion cell layer. Scale bars: 80µm.
Figure 9
Figure 9
ChAT+ amacrine cells express β-endorphin in the wild-type mouse retina. A: A slightly tangential section of wild-type mouse retina showing ChAT+ (green) soma distribution in the INL and GCL together with two bands of immunolabeled processes in the IPL. B: DAB amplification of cryostat sectioned retinas for visualization of β-endorphin, illustrating the same region as A. C: A merged image of A and B, showing uniform colocalization of β-endorphin+ cell bodies with ChAT+ cells, black arrows. Note that not all ChAT+ cells are β-endorphin+. Scale bar: 20µm.
Figure 10
Figure 10
β-endorphin antibody labeling is specific to POMC neurons in both retina and hypothalamus. A: POMC-DsRed (magenta) retina showing DsRed+ soma distribution in both the INL and GCL with two DsRed bands in the IPL. B: Same region as in A, showing β-endorphin+ somas within GCL. C: A merged image of A and B, showing colocalization of POMC-DsRed+ cell bodies with β-endorphin+ somas. D: Vertical cryostat section through POMC-KO retina immunolabeled for ChAT (magenta), showing ChAT+ cell bodies, with two bands in the IPL. E: Image illustrating the same area as D, stained with anti-bodies against β-endorphin (green), showing no specific labeling of somas or projections. F: A merged image of D and E, showing only ChAT+ cell bodies and projections. G: β-endorphin immunolabeling (magenta) in the arcuate nucleus of hypothalamus in wild type mouse. H: β-endorphin immunolabeling (magenta) in the arcuate nucleus of the hypothalamus in POMC KO (Pomc−/−Tg) mouse. Scale bars: 20µm.

Similar articles

Cited by

References

    1. Altschuler RA, Mosinger JL, Hoffman DW, Parakkal MH. Immunocytochemical localization of enkephalin-like immunoreactivity in the retina of the guinea pig. Proc Natl Acad Sci U S A. 1982;79(7):2398–2400. - PMC - PubMed
    1. Andrade da Costa BL, Hokoc JN. Coexistence of GAD-65 and GAD-67 with tyrosine hydroxylase and nitric oxide synthase in amacrine and interplexiform cells of the primate, Cebus apella. Vis Neurosci. 2003;20(2):153–163. - PubMed
    1. Bicknell AB. The tissue-specific processing of pro-opiomelanocortin. J Neuroendocrinol. 2008;20(6):692–699. - PubMed
    1. Borbe HO, Wollert U, Muller WE. Stereospecific [3H]naloxone binding associated with opiate receptors in bovine retina. Exp Eye Res. 1982;34(4):539–544. - PubMed
    1. Brecha NC. Peptide and peptide receptor expression and function in the vertebrate retina. In: Chalupa, Werner, editors. The visual neurosciences. Cambridge, Massatchusetts: The MIT Press; 2003. pp. 334–354.

Publication types

MeSH terms