

Imaging metabolic syndrome
- PMID: 20533426
- PMCID: PMC3377322
- DOI: 10.1002/emmm.201000074
Imaging metabolic syndrome
Abstract
Metabolic syndrome is a fast growing public health burden for almost all the developed countries and many developing nations. Despite intense efforts from both biomedical and clinical scientists, many fundamental questions regarding its aetiology and development remain unclear, partly due to the lack of suitable imaging technologies to visualize lipid composition and distribution, insulin secretion, beta-cell mass and functions in vivo. Such technologies would not only impact on our understanding of the complexity of metabolic disorders such as obesity and diabetes, but also aid in their diagnosis, drug development and assessment of treatment efficacy. In this article we discuss and propose several strategies for visualization of physiological and pathological changes that affect pancreas and adipose tissue as a result of the development of metabolic diseases.
Figures
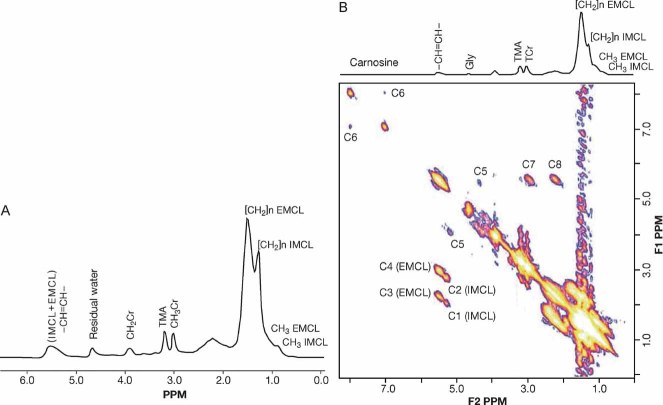
1D spectrum including the olefinic protons −(CH=CH−) obtained by 1D point-resolved spectroscopy (PRESS) from soleus muscle. The CH3 and (CH2)n from the IMCL and EMCL pools are seen, along with creatine and trimethyl amine (TMA) protons.
Localized 2D correlation spectrum (L-COSY) recorded from soleus muscle of a normal weight healthy subject. The spectrum shows the diagonal and cross-peaks from various resonances of both IMCL and EMCL pools. The cross-peaks due to olefinic (−CH=CH−) and allylic methylene protons (CH2CH=CH) and diallylic methylene protons (−CH=CH−CH2−CH=CH−) permits estimation of degree of unsaturation.
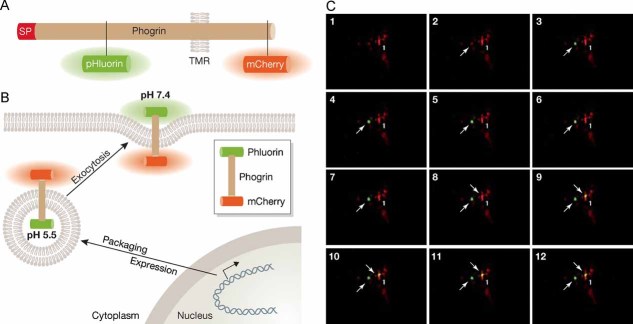
The sensor is based on a chimeric fusion protein that consists of a secretory granule resident protein, phogrin and two fluorescent proteins: a highly pH-sensitive pHluorin inside the secretory granules and a red mCherry.
Schematic showing the design strategy of the optical sensor. pHluorin is inside the acidic lumen and remains non-fluorescent at resting state. Upon exocytosis, pHluorin faces the extracellular fluid at neutral pH, and becomes highly fluorescent, while mCherry remains in the cytosol during the process, and serves as a label for granule tracking and a standard for ratiometric quantification (adapted from Lu et al, 2009).
A time-lapse showing detected exocytosis events in insulin-secreting cells. Arrows indicate exocytosed insulin granules. SP, signal peptide; TMR, transmembrane region. The images are unpublished observations by Gustavsson.
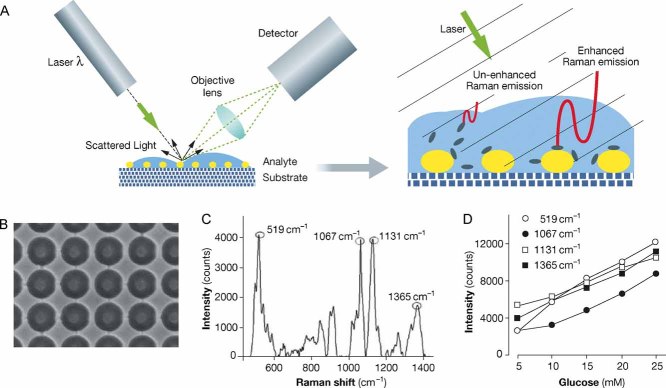
Basic concept of SERS. Raman scattering occurs at very low intensities in solution phase when molecules (oval-shaped grains) are distant from the metallic nanoparticles (yellow spheres). When the molecule is close to the nanosurface, upon laser excitation, the intensity is enhanced by the interaction of the molecule with the surface electrons.
Scanning EM image of silver and gold bimetallic SERS substrate by deep UV lithography on silicon wafers designed for glucose sensing.
Raman spectrum of glucose. Glucose sensing using surface functionalized bimetallic SERS substrate shown in 5B in SERS mode. The peaks indicate different vibrational levels in the molecules. Note that the narrowness of the peaks allows structurally similar multiple analytes to be detected simultaneously.
Glucose quantification by SERS-based glucose sensing. Areas-under-curves of the vibrational bands of glucose Raman spectrum at 519, 1067, 1131 and 1365 cm−1 are plotted against glucose concentrations.
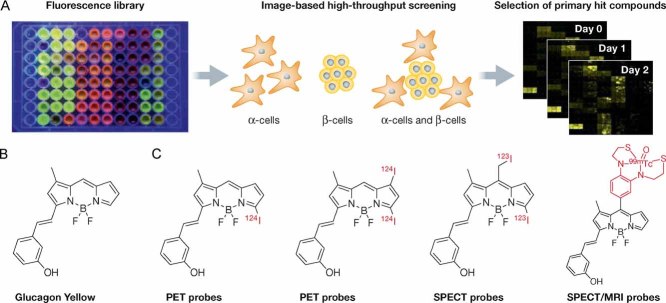
DOFLA preparation and high throughput screening in α- and β-cells to identify a probe specific for each of the cell types.
Structure of an α-cell selective probe Glucagon Yellow.
Examples of some potential modifications to convert Glucagon Yellow into PET or SPECT probes. The 99mTc ligand could also be replaced by a Gd chelate to form an MRI contrast agent.
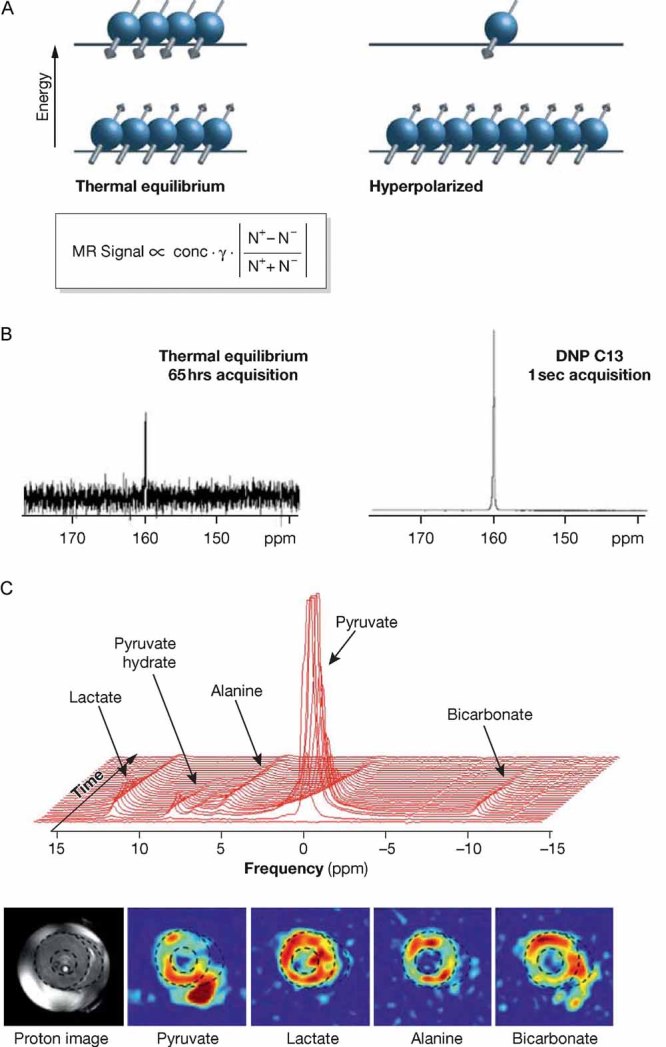
The NMR signal is proportional to the difference between two populations of nuclei in distinct energy levels. Hyperpolarization of the 13C nuclei produces a large difference as compared to the thermal equilibrium state thus increasing the NMR signal. N+/N−: number of nuclei in high/low energy state.
The thermal equilibrium 13C spectrum of urea at 9.4 T averaged for 65 h is depicted on the left while the analysis of the same sample, hyperpolarized by the DNP-MR method and acquired in 1 s is presented on the right (adapted from Ardenkjaer-Larsen et al, 2003).
Time course of spectra acquired every second over a 60 s period after injection of hyperpolarized [1-13C]pyruvate from the heart of a male Wistar rat (adapted from Tyler et al, 2008). As the pyruvate signal decays, one can observe the generation of lactate, alanine and bicarbonate. Chemical shift imaging of these metabolites from a perfused rat heart depicts the biodistribution. The proton image is given for anatomical reference. The images are unpublished observations by Lee.
References
-
- Ahn YH, Lee JS, Chang YT. Combinatorial rosamine library and application to in vivo glutathione probe. J Am Chem Soc. 2007;129:4510–4511. - PubMed
-
- Ahn YH, Lee JS, Chang YT. Selective human serum albumin sensor from the screening of a fluorescent rosamine library. J Comb Chem. 2008;10:376–380. - PubMed
-
- Bailey IA, Gadian DG, Matthews PM, Radda GK, Seeley PJ. Studies of metabolism in the isolated, perfused rat heart using 13C NMR. FEBS Lett. 1981;123:315–318. - PubMed
Publication types
MeSH terms
LinkOut - more resources
Full Text Sources
Medical
