. 2011 Jun;32(6):919-34.
doi: 10.1002/hbm.21079. Epub 2010 Jun 9.

Network anticorrelations, global regression, and phase-shifted soft tissue correction

Affiliations

Network anticorrelations, global regression, and phase-shifted soft tissue correction

Jeffrey S Anderson et al. Hum Brain Mapp. 2011 Jun.

Abstract

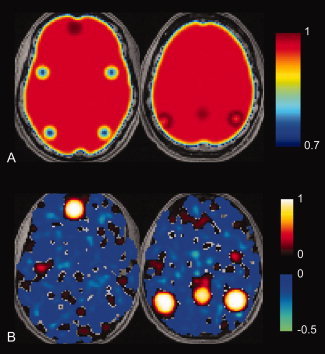
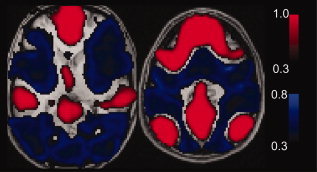
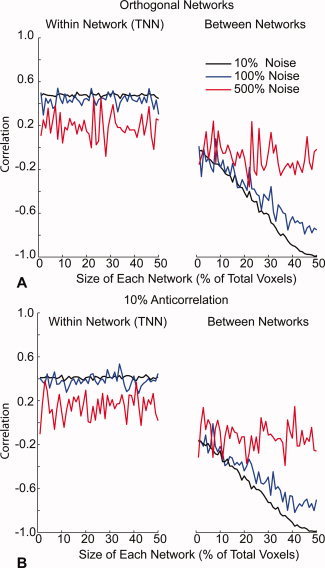
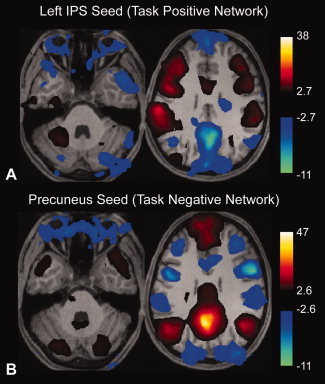
Synchronized low-frequency BOLD fluctuations are observed in dissociable large-scale, distributed networks with functional specialization. Two such networks, referred to as the task-positive network (TPN) and the task-negative network (TNN) because they tend to be active or inactive during cognitively demanding tasks, show reproducible anticorrelation of resting BOLD fluctuations after removal of the global brain signal. Because global signal regression mandates that anticorrelated regions to a given seed region must exist, it is unclear whether such anticorrelations are an artifact of global regression or an intrinsic property of neural activity. In this study, we demonstrate from simulated data that spurious anticorrelations are introduced during global regression for any two networks as a linear function of their size. Using actual resting state data, we also show that both the TPN and TNN become anticorrelated with the orbits when soft tissues are included in the global regression algorithm. Finally, we propose a technique using phase-shifted soft tissue regression (PSTCor) that allows improved correction of global physiological artifacts without global regression that shows improved anatomic specificity to global regression but does not show significant network anticorrelations. These results imply that observed anticorrelations between TNN and TPN may be largely or entirely artifactual in the resting state. These results also imply that differences in network anticorrelations attributed to pathophysiological or behavioral states may be due to differences in network size or recruitment rather than actual anticorrelations.


Figures

Figure 1
Figure 1
Areas of least correlation to default mode network do not necessarily become anticorrelated after global regression. A: Location of regions of interest corresponding to simulated TNN and TPN show highest correlation to posterior cingulate seed in TPN and lowest correlation in TNN prior to global regression. Scale bar shows correlation values to posterior cingulate seed. B: Following global regression, the TNN is strongly correlated, but the remaining brain shows patchwork pattern of correlation and anticorrelation that is unrelated to presence of uncorrelated TNN signal. [Color figure can be viewed in the online issue, which is available at wileyonlinelibrary.com.]
Figure 2
Figure 2
Large networks become anticorrelated after global regression. Simulation is identical to Figure 1 except that actual boundaries of TPN and TNN were used from resting state data obtained from 27 subjects. In this case, the TPN becomes strongly anticorrelated to the TNN. [Color figure can be viewed in the online issue, which is available at wileyonlinelibrary.com.]
Figure 3
Figure 3
Network anticorrelations after global regression are a linear function of the size of the networks. A: 100 voxel simulation with similar parameters to those above shows little effect of increased network size on correlation within the TNN (left). But TPN and TNN (right) become increasingly anticorrelated following global regression as network size increases. B: Similar results are seen in simulations for which a 10% anticorrelated signal was introduced into the TPN. The initial baseline anticorrelation is greater, but a similar linear trend towards greater anticorrelations with network size is seen. [Color figure can be viewed in the online issue, which is available at wileyonlinelibrary.com.]
Figure 4
Figure 4
Global regression to combined brain and soft tissue mask induces anticorrelations between the orbits and both task‐positive and task‐negative networks. Results are thresholded at q < 0.05, FDR. A: Correlation to left intraparietal sulcus seed region. B: Correlation to posterior cingulate seed region. Images are shown in radiological format (subject left is on image right). [Color figure can be viewed in the online issue, which is available at wileyonlinelibrary.com.]
Figure 5
Figure 5
Phase‐shifted Soft Tissue Regression (PSTCor). A: White matter, CSF, and soft tissue masks used as regressors for one subject. B: Average cross‐correlograms of the mean gray matter time series to the time series for white matter (WM), CSF, soft tissues, respiration volume per time convolved with respiratory response function (RVT/RRF), chest expansion (Respirations, integrated over 2 s epochs to correspond to each image volume), pulse oximetry (Pulse, integrated over 2 s epochs), and six motion parameters from realignment procedure. Cross‐correlograms were averaged for 27 subjects, and shaded areas show one standard error of the mean above and below the cross‐correlograms. [Color figure can be viewed in the online issue, which is available at wileyonlinelibrary.com.]
Figure 6
Figure 6
Resting state fMRI data—default mode network. Slice locations are at z = −18, 10, 48, MNI coordinates. A: Correlation to posterior cingulate/precuneus seed following global regression (q < 0.05, FDR). B: Following RETROICOR, images show voxels with significantly greater correlation to posterior cingulate seed than to soft tissue mask. (Paired t‐test, FDR corrected, q < 0.05). C: Following RETROICOR and PSTCor, images show voxels with significantly greater correlation to posterior cingulate seed than to soft tissue mask. (Paired t‐test, FDR corrected, q < 0.05). D: Following RETROICOR and PSTCor, images show mean correlation to posterior cingulate seed. Correlation values were converted using Fisher z‐transform prior to averaging across subjects, then converted back to correlation values after averaging. Subject left is on image right for all images.
Figure 7
Figure 7
Resting state fMRI data—anatomic specificity of thalamocortical connectivity. Significance levels were varied to show areas within the thalamus of greatest correlation to the seed region. A: Correlation to right primary visual cortical seed (slice location z = −8, MNI). Center images show correlation to V1 seed greater than correlation to soft tissue mask following RETROICOR and PSTCor (Paired t‐test, q < 0.001, FDR). Right images show correlation following global regression (q < 0.05, FDR. Slice locations: z = 1, y = −29, MNI.) B: Correlation to left primary auditory cortical seed (slice location z = 1, MNI). Center images show correlation to seed greater than correlation to soft tissue mask following RETROICOR and PSTCor (Paired t‐test, q < 0.01, FDR). Right images show correlation following global regression (P < 0.05, uncorrected. Slice locations: z = 1, y = −20, MNI.) C: Correlation to prefrontal cortical mask (slice location z = 40). Center images show correlation to seed greater than correlation to soft tissue mask following RETROICOR and PSTCor (Paired t‐test, q < 0.00001, FDR). Right images show correlation following global regression (P < 0.05, uncorrected. Slice locations: z = 1, y = −20, MNI.) All images show subject left on image right. [Color figure can be viewed in the online issue, which is available at wileyonlinelibrary.com.]
Figure 8
Figure 8
Task‐activated compared with resting fMRI data—Anatomic specificity of connectivity compared with motor task activation. A: Seed region in left primary motor cortex (MNI coordinates: −48, −24, 60) obtained from peak activation in bilateral finger movement task. B: Correlation to seed region following global regression (P < 0.05, uncorrected. Slice locations at z = 41, z = 10, z = −35, MNI.) No significant correlation was seen in the basal ganglia, thalami, or cerebellum. C: Correlation to seed region greater than to soft tissue mask following RETROICOR and PSTCor (q < 0.05, FDR.) D: Activation to a bilateral finger movement task in the same 27 subjects produced by general linear model (q < 0.05, FDR). [Color figure can be viewed in the online issue, which is available at wileyonlinelibrary.com.]

Similar articles

Cited by

References

    1. Anderson JS ( 2008): Origin of synchronized low‐frequency blood oxygen level‐dependent fluctuations in the primary visual cortex. AJNR Am J Neuroradiol 29: 1722–1729. - PMC - PubMed
    1. Anderson J, Lange N, Froehlich A, DuBray M, Druzgal T, Froimowitz M, Alexander A, Bigler E, Lainhart J ( 2010): Decreased left posterior insular activity during auditory langauge in autism. AJNR Am J Neuroradiol 31: 131–139. - PMC - PubMed
    1. Birn RM, Diamond JB, Smith MA, Bandettini PA ( 2006): Separating respiratory‐variation‐related fluctuations from neuronal‐activity‐related fluctuations in fMRI. Neuroimage 31: 1536–1548. - PubMed
    1. Birn RM, Murphy K, Bandettini PA ( 2008a): The effect of respiration variations on independent component analysis results of resting state functional connectivity. Hum Brain Mapp 29: 740–750. - PMC - PubMed
    1. Birn RM, Smith MA, Jones TB, Bandettini PA ( 2008b): The respiration response function: The temporal dynamics of fMRI signal fluctuations related to changes in respiration. Neuroimage 40: 644–654. - PMC - PubMed

Publication types