

Structural and functional bases for individual differences in motor learning
- PMID: 20533562
- PMCID: PMC3674543
- DOI: 10.1002/hbm.21037
Structural and functional bases for individual differences in motor learning
Abstract
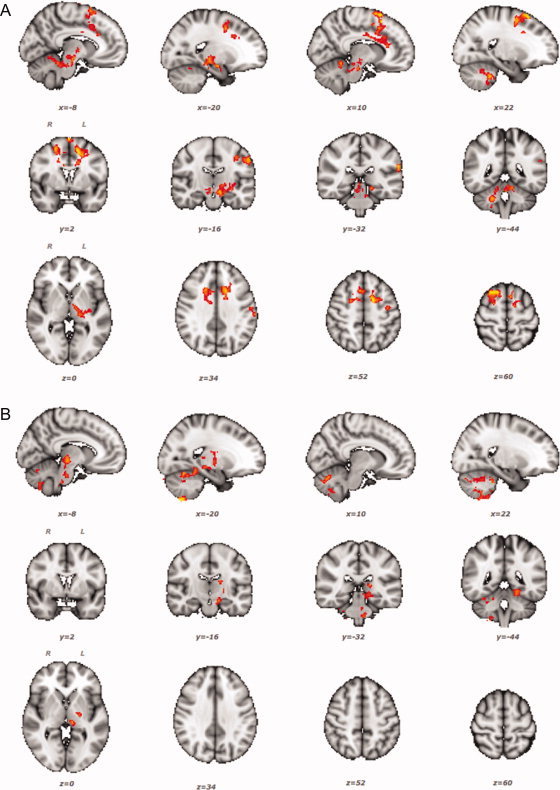
People vary in their ability to learn new motor skills. We hypothesize that between-subject variability in brain structure and function can explain differences in learning. We use brain functional and structural MRI methods to characterize such neural correlates of individual variations in motor learning. Healthy subjects applied isometric grip force of varying magnitudes with their right hands cued visually to generate smoothly-varying pressures following a regular pattern. We tested whether individual variations in motor learning were associated with anatomically colocalized variations in magnitude of functional MRI (fMRI) signal or in MRI differences related to white and grey matter microstructure. We found that individual motor learning was correlated with greater functional activation in the prefrontal, premotor, and parietal cortices, as well as in the basal ganglia and cerebellum. Structural MRI correlates were found in the premotor cortex [for fractional anisotropy (FA)] and in the cerebellum [for both grey matter density and FA]. The cerebellar microstructural differences were anatomically colocalized with fMRI correlates of learning. This study thus suggests that variations across the population in the function and structure of specific brain regions for motor control explain some of the individual differences in skill learning. This strengthens the notion that brain structure determines some limits to cognitive function even in a healthy population. Along with evidence from pathology suggesting a role for these regions in spontaneous motor recovery, our results also highlight potential targets for therapeutic interventions designed to maximize plasticity for recovery of similar visuomotor skills after brain injury.
Copyright © 2010 Wiley-Liss, Inc.
Figures


Similar articles
-
Specific increases within global decreases: a functional magnetic resonance imaging investigation of five days of motor sequence learning.J Neurosci. 2010 Jun 16;30(24):8332-41. doi: 10.1523/JNEUROSCI.5569-09.2010. J Neurosci. 2010. PMID: 20554884 Free PMC article.
-
Functional connectivity between somatosensory and motor brain areas predicts individual differences in motor learning by observing.J Neurophysiol. 2017 Aug 1;118(2):1235-1243. doi: 10.1152/jn.00275.2017. Epub 2017 May 31. J Neurophysiol. 2017. PMID: 28566463 Free PMC article.
-
Changing brain networks for visuomotor control with increased movement automaticity.J Neurophysiol. 2004 Oct;92(4):2405-12. doi: 10.1152/jn.01092.2003. J Neurophysiol. 2004. PMID: 15381748 Clinical Trial.
-
Distinct contribution of the cortico-striatal and cortico-cerebellar systems to motor skill learning.Neuropsychologia. 2003;41(3):252-62. doi: 10.1016/s0028-3932(02)00158-6. Neuropsychologia. 2003. PMID: 12457751 Review.
-
A computational neuroanatomy for motor control.Exp Brain Res. 2008 Mar;185(3):359-81. doi: 10.1007/s00221-008-1280-5. Epub 2008 Feb 5. Exp Brain Res. 2008. PMID: 18251019 Free PMC article. Review.
Cited by
-
Initial motor skill performance predicts future performance, but not learning.Sci Rep. 2023 Jul 13;13(1):11359. doi: 10.1038/s41598-023-38231-5. Sci Rep. 2023. PMID: 37443195 Free PMC article.
-
Baseline frontostriatal-limbic connectivity predicts reward-based memory formation.Hum Brain Mapp. 2014 Dec;35(12):5921-31. doi: 10.1002/hbm.22594. Epub 2014 Jul 31. Hum Brain Mapp. 2014. PMID: 25078102 Free PMC article.
-
Changes in brain perfusion with training-related visuomotor improvement in MS.Front Mol Neurosci. 2023 Nov 9;16:1270393. doi: 10.3389/fnmol.2023.1270393. eCollection 2023. Front Mol Neurosci. 2023. PMID: 38025268 Free PMC article.
-
The cerebellum and cognition: evidence from functional imaging studies.Cerebellum. 2012 Jun;11(2):352-65. doi: 10.1007/s12311-011-0260-7. Cerebellum. 2012. PMID: 21373864 Review.
-
Rich-club organization of whole-brain spatio-temporal multilayer functional connectivity networks.Front Neurosci. 2024 May 24;18:1405734. doi: 10.3389/fnins.2024.1405734. eCollection 2024. Front Neurosci. 2024. PMID: 38855440 Free PMC article.
References
-
- Aguirre GK, Detre JA, Alsop DC, D'Esposito M ( 1996): The parahippocampus subserves topographical learning in man. Cereb Cortex 6: 823–829. - PubMed
-
- Ashburner J, Friston KJ ( 2000): Voxel‐based morphometry—The methods. Neuroimage 11 ( 6, Part 1): 805–821. - PubMed
-
- Baron JC, Rougemont D, Soussaline F, Bustany P, Crouzel C, Bousser MG, Comar D ( 1984): Local interrelationships of cerebral oxygen consumption and glucose utilization in normal subjects and in ischemic stroke patients: A positron tomography study. J Cereb Blood Flow Metab 4: 140–149. - PubMed
-
- Beaulieu C ( 2002): The basis of anisotropic water diffusion in the nervous system—A technical review. NMR Biomed 15: 435–455. - PubMed
Publication types
MeSH terms
Substances
Grants and funding
LinkOut - more resources
Full Text Sources
