. 2010 Jun 22;107(25):11234-9.
doi: 10.1073/pnas.1000156107. Epub 2010 Jun 4.

Quantitative 3D imaging of whole, unstained cells by using X-ray diffraction microscopy

Affiliations

Quantitative 3D imaging of whole, unstained cells by using X-ray diffraction microscopy

Huaidong Jiang et al. Proc Natl Acad Sci U S A. .

Abstract

Microscopy has greatly advanced our understanding of biology. Although significant progress has recently been made in optical microscopy to break the diffraction-limit barrier, reliance of such techniques on fluorescent labeling technologies prohibits quantitative 3D imaging of the entire contents of cells. Cryoelectron microscopy can image pleomorphic structures at a resolution of 3-5 nm, but is only applicable to thin or sectioned specimens. Here, we report quantitative 3D imaging of a whole, unstained cell at a resolution of 50-60 nm by X-ray diffraction microscopy. We identified the 3D morphology and structure of cellular organelles including cell wall, vacuole, endoplasmic reticulum, mitochondria, granules, nucleus, and nucleolus inside a yeast spore cell. Furthermore, we observed a 3D structure protruding from the reconstructed yeast spore, suggesting the spore germination process. Using cryogenic technologies, a 3D resolution of 5-10 nm should be achievable by X-ray diffraction microscopy. This work hence paves a way for quantitative 3D imaging of a wide range of biological specimens at nanometer-scale resolutions that are too thick for electron microscopy.


Conflict of interest statement

The authors declare no conflict of interest.

Figures

Fig. 1.
Fig. 1.
Schematic layout of the 3D X-ray diffraction microscope. A 20 μm pinhole and a guard slit were used to define a clean X-ray beam. Oversampled diffraction patterns, measured on a CCD camera, were directly phased to obtain 2D projectional images. The 3D image of a whole cell was reconstructed from the set of 2D projectional images by a tomographic method.
Fig. 2.
Fig. 2.
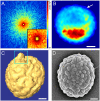
Representative diffraction pattern and reconstructions of a whole yeast spore cell. (A) A 2D diffraction pattern (768 × 768 pixels) measured from the yeast spore. The diffraction intensity, displayed in a logrithmatic scale (zero valued pixels are set to a very small number to avoid infinity), extends to q = 24.6 μm-1 at the edge. The inset shows the missing center (15 × 17 pixels) is confined within the centro-speckle. Color scale shows the number of photons. (B) The corresponding reconstructed projectional image. The arrow indicates the thick spore wall, which was estimated to be ∼120 nm. (C) Isosurface rendering of the reconstructed 3D image where the rough surface of the yeast spore is clearly visible. The dotted square indicates that a sporeline likely protrudes from the spore surface. (D) SEM image of a different yeast spore formed at the same condition. (Scale bar: 500 nm.)
Fig. 3.
Fig. 3.
Quantification of the 3D resolution. (A) The density variation across a mitochondrion was plotted along the x, y, and z axes, which was used to estimate the 3D resolution of the reconstructed yeast spore. Color scale is in g/cm3. (B and C) A resolution of ∼41 nm (i.e., 2 pixels) along the x and y axes was achieved. (D) A resolution of ∼62 nm (i.e., 3 pixels) along the z axis was achieved.
Fig. 4.
Fig. 4.
Three-dimensional visualization of the cellular organelles inside the yeast spore cell. (A) A 3D volume rendering of the reconstructed yeast spore, showing nucleus (orange), ER (green), vacuole (white), mitochondria (blue), and granules (light blue). (Scale bar: 500 nm.) (B) Zoomed view of the 3D morphology and structure of the nucleus, ER, and mitochondria. Inset shows the nucleolus (orange). (Scale bar: 200 nm.) (C) A 3D morphology and structure of the vacuole. Inset shows a cross-sectional image of the vacuole. (Scale bar: 200 nm.) (D and E) A thin slice of the reconstructed yeast spore and a line scan along the dashed line, showing the density variation across a mitochondrion and the vacuole.
Fig. 5.
Fig. 5.
Successive slices of the sporeline along the horizontal (A) and vertical (B) directions with each slice being 20.5-nm thick. A high-density region (white arrow) and a low-density region (yellow arrow) are clearly visible. (Scale bar: 200 nm.)

References

    1. Miao J, Charalambous P, Kirz J, Sayre D. Extending the methodology of X-ray crystallography to allow imaging of micrometre-sized non-crystalline specimens. Nature. 1999;400:342–344.
    1. Robinson IK, Vartanyants IA, Williams GJ, Pfeifer MA, Pitney JA. Reconstruction of the shapes of gold nanocrystals using coherent X-ray diffraction. Phys Rev Lett. 2001;87:195505. - PubMed
    1. Miao J, et al. High resolution 3D X-ray diffraction microscopy. Phys Rev Lett. 2002;89:088303. - PubMed
    1. Williams GJ, Pfeifer MA, Vartanyants IA, Robinson IK. Three-dimensional imaging of microstructure in Au nanocrystals. Phys Rev Lett. 2003;90:175501. - PubMed
    1. Miao J, et al. Imaging whole Escherichia coli bacteria by using single particle X-ray diffraction. Proc Natl Acad Sci USA. 2003;100:110–112. - PMC - PubMed

Publication types

LinkOut - more resources