. 2010 Jun 15;107(24):10920-5.
doi: 10.1073/pnas.0914776107. Epub 2010 Jun 1.

Pseudopodium-enriched atypical kinase 1 regulates the cytoskeleton and cancer progression [corrected]

Affiliations

Pseudopodium-enriched atypical kinase 1 regulates the cytoskeleton and cancer progression [corrected]

Yingchun Wang et al. Proc Natl Acad Sci U S A. .

Erratum in

  • Proc Natl Acad Sci U S A. 2010 Jul 27;107(30):13556

Abstract

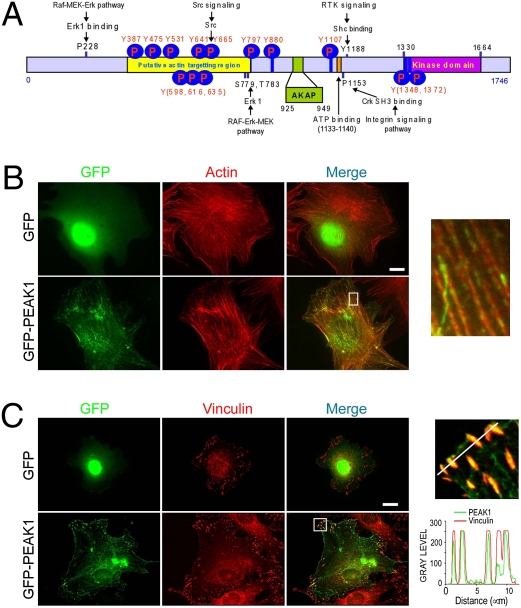
Regulation of the actin-myosin cytoskeleton plays a central role in cell migration and cancer progression. Here, we report the discovery of a cytoskeleton-associated kinase, pseudopodium-enriched atypical kinase 1 (PEAK1). PEAK1 is a 190-kDa nonreceptor tyrosine kinase that localizes to actin filaments and focal adhesions. PEAK1 undergoes Src-induced tyrosine phosphorylation, regulates the p130Cas-Crk-paxillin and Erk signaling pathways, and operates downstream of integrin and epidermal growth factor receptors (EGFR) to control cell spreading, migration, and proliferation. Perturbation of PEAK1 levels in cancer cells alters anchorage-independent growth and tumor progression in mice. Notably, primary and metastatic samples from colon cancer patients display amplified PEAK1 levels in 81% of the cases. Our findings indicate that PEAK1 is an important cytoskeletal regulatory kinase and possible target for anticancer therapy.


Conflict of interest statement

The authors declare no conflict of interest.

Figures

Fig. 1.
Fig. 1.
PEAK1 localizes to the actin cytoskeleton and focal adhesions. (A) Schematic showing predicted PEAK1 protein domains, motifs, and known pY sites. (B and C) Immunofluorescence images showing GFP-PEAK1 colocalization with the actin cytoskeleton and vinculin-positive focal adhesions (red) in NIH 3T3 fibroblast cells. White boxes (Inset) show the respective zoomed images. The fluorescence intensity of GFP-PEAK1 and vinculin along the indicated line were scanned by using MetaMorph imaging software, and their colocalization was determined by using the Pearson correlation coefficient (r = 0.91) method. (Scale bars: 15 μm.)
Fig. 2.
Fig. 2.
PEAK1 regulates cytoskeletal and focal adhesion proteins and undergoes Src kinase-dependent tyrosine phosphorylation in response to cell adhesion or EGF stimulation. (A) Protein lysates of 293T cells expressing GFP-PEAK1 (PEAK1) in suspension (Sus) or attached (Atta) to fibronectin (FN) were immunoblotted with indicated total protein and pY site-specific antibodies. (B) Lysates from PEAK1-specific siRNA (siPEAK1) or scrambled control siRNA (siCtrl)-treated cells in suspension or attached to FN for 30 min were immunoblotted as in A. (C) GFP, GFP-PEAK1, and GFP-PEAK1 truncated forms (N1–N3, C1, and C2; Fig. S4A) were immunoprecipitated then immunoblotted for associated Crk and Cas proteins. Whole-cell lysates were also immunoblotted for the indicated proteins. (D and E) pY Western blots of GFP-PEAK1 immunoprecipitated from cells stimulated or not stimulated with EGF for 10 min (D) or stimulated with EGF and in the absence or presence of the Src kinase inhibitor PP2 (E). (F and G) pY Western blots of GFP-PEAK1 immunoprecipitated from cells in suspension (Sus) or reattached to 5 μg/mL of poly-L-lysine (PLL), FN, or laminin (LN), respectively, (F) or cells reattached to FN in the absence or presence of PP2 (G). Total PEAK1 levels in E and F were detected by Ponceau staining. (H) pY immunoprecipitation of total lysates from wild-type (+/+) or Src/Fyn/Yes (SYF) knockout (−/−) MEFs and Western blots for PEAK1 after EGF stimulation for 10 min.
Fig. 3.
Fig. 3.
PEAK1 regulates cell spreading and directional cell migration. Cos-7 cells treated with siPEAK1 or siCtrl (A) or HEK 293T cells expressing exogenous GFP-PEAK1 or GFP (B) only were allowed to attach and spread on 5 μg/mL fibronectin for the indicated times. Cell areas were measured by using MetaMorph. Bars indicate mean ± SD in all figures unless indicated otherwise. *P < 0.01; **P < 0.001. Cos-7 cell chemotaxis toward LPA after treatment with siPEAK1 or siCtrl (C) or overexpression of GFP-PEAK1 or GFP (D). (E) Cell migration toward FN of XPA-1 pancreatic cancer cells treated with shRNA specific for PEAK1 (shPEAK1) or a scrambled control shRNA (shCtrl). (F and G) Cells (5 × 10⁴) as in E were plated onto FN-coated six-well plates, and >70 cells were tracked in each population by using phase-contrast microscopy and MetaMorph software during the subsequent 24 h. The resulting endpoint displacement (F) and cell migration persistance (G) were plotted. (H) After cell migration tracking as in F and G, cell velocity was quantified for shCtrl and shPEAK1 cell populations that were transiently transfected with empty vector or Src overexpression vector. ***P < 0.0001.
Fig. 4.
Fig. 4.
PEAK1 promotes oncogenic growth of cancer cells in vitro and in vivo and is up-regulated in human colon cancer. Comparison of soft agar colony size and number in MDA-435 cells expressing GFP-PEAK1 or GFP only (A) or depleted of GFP-PEAK1 by shRNA (B) (see also Fig. S5). The area of the colonies is shown as mean ± SEM. (C) Cells from A and B were cultured under suspension conditions for 30 min followed by lysis and Western blot analysis of P-Erk and total Erk proteins. (D) Whole-animal fluorescent images of MDA-435-GFP (GFP) and MDA-435-PEAK1 (PEAK1) cancer cells allowed to grow s.c. in nude mice for 9 wk. (E) Tumor data from mice shown in D: Upper, average tumor weight after tumor excision; Lower, average tumor area as measured by whole-body fluorescence imaging throughout the course of the experiment. (F) Average tumor size of XPA-1 human pancreatic cancer cells stably expressing control scrambled or PEAK1 shRNA and growing orthotopically in the pancreas of nude mice for 4 and 5 wk. The data are shown as mean ± SEM for E and F. (G) Representative in situ hybridization images of PEAK1 expression levels (red stain) in normal colon tissue (NC), primary colon cancer tissue (CC), and a liver metastasis (LM) taken from the same patient.

References

    1. Hall A. Rho GTPases and the actin cytoskeleton. Science. 1998;279:509–514. - PubMed
    1. Gupton SL, Gertler FB. Filopodia: The fingers that do the walking. Sci STKE. 2007;2007:re5. - PubMed
    1. Pollard TD, Borisy GG. Cellular motility driven by assembly and disassembly of actin filaments. Cell. 2003;112:453–465. - PubMed
    1. Ridley AJ, et al. Cell migration: Integrating signals from front to back. Science. 2003;302:1704–1709. - PubMed
    1. Small JV, Stradal T, Vignal E, Rottner K. The lamellipodium: Where motility begins. Trends Cell Biol. 2002;12:112–120. - PubMed

Publication types

MeSH terms