. 2010 Jun 15;107(24):10996-1001.
doi: 10.1073/pnas.1006214107. Epub 2010 Jun 1.

Complex I deficiency due to loss of Ndufs4 in the brain results in progressive encephalopathy resembling Leigh syndrome

Affiliations

Complex I deficiency due to loss of Ndufs4 in the brain results in progressive encephalopathy resembling Leigh syndrome

Albert Quintana et al. Proc Natl Acad Sci U S A. .

Abstract

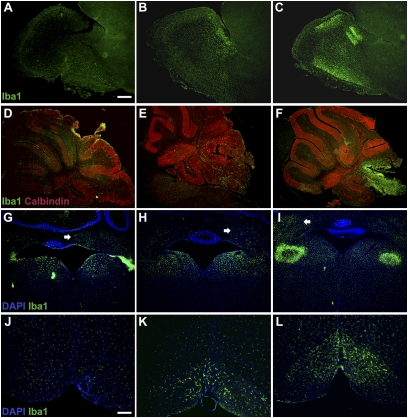
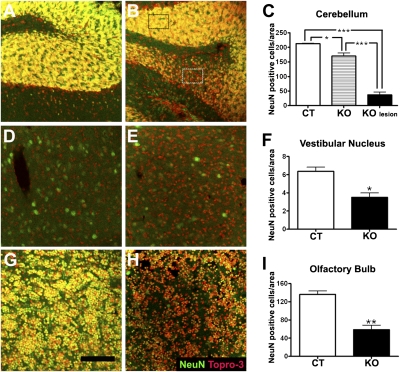
To explore the lethal, ataxic phenotype of complex I deficiency in Ndufs4 knockout (KO) mice, we inactivated Ndufs4 selectively in neurons and glia (NesKO mice). NesKO mice manifested the same symptoms as KO mice including retarded growth, loss of motor ability, breathing abnormalities, and death by approximately 7 wk. Progressive neuronal deterioration and gliosis in specific brain areas corresponded to behavioral changes as the disease advanced, with early involvement of the olfactory bulb, cerebellum, and vestibular nuclei. Neurons, particularly in these brain regions, had aberrant mitochondrial morphology. Activation of caspase 8, but not caspase 9, in affected brain regions implicate the initiation of the extrinsic apoptotic pathway. Limited caspase 3 activation and the predominance of ultrastructural features of necrotic cell death suggest a switch from apoptosis to necrosis in affected neurons. These data suggest that dysfunctional complex I in specific brain regions results in progressive glial activation that promotes neuronal death that ultimately results in mortality.


Conflict of interest statement

The authors declare no conflict of interest.

Figures

Fig. 1.
Fig. 1.
Vacuolation and vascular proliferation in NesKO and KO mice. (A) No pathology is observed in H&E staining of brain sections of CT animals (n = 5). (B and C) In contrast, both late-stage NesKO (B, n = 5) and KO (C, n = 5) mice show marked vacuolation in the VN (black arrows; Inset shows higher magnification of indicated area) and, to a lesser extent, in deep cerebellar nuclei (white arrow). (D–F) Vascular proliferation, as assessed by laminin staining, was increased around the VN in NesKO (E) and KO (F) mice compared with CT (D). (Scale bar, A–F, 125 μm; Inset, 25 μm.)
Fig. 2.
Fig. 2.
Progressive inflammatory response in the brains of KO mice. (A–C) Microglial activation in the OB of KO mice at early (A), middle (B), or late (C) stage of the disease was determined using an antibody against Iba-1.(D-F) Calbindin and Iba-1 staining in the cerebellum of KO mice at early (D), middle (E), or late (F) stage of the disease. (G–I) Iba-1 staining in the vestibular and deep cerebellar nuclei of KO mice at early (G), middle (H), or late stage (I) of the disease. (J–L) Iba-1 staining in the IO of KO mice at early (J), middle (K), or late stage (L) of the disease. Iba-1 staining in the brains of KO mice at different stages of the disease (early, middle, and late stages; n = 5 each) shows a localized and progressive inflammatory response. In early-stage animals (A, D, G, and J), marked microglial activation is already present in the OB (A), VN (G), and deep cerebellar nuclei (G, arrow). However, no microglial response is visible in either the cerebellum (D) or in the vicinity of the IO (J). In middle-stage animals (B, E, H, and K), enhanced microglial accumulation is observed in the OB (B), VN (H), and, to a lesser extent, in the deep cerebellar nuclei (H, arrow), cerebellar lobes (E), and IO (K). In late-stage animals (C, F, I, and L), severe microglial activation is observed in the olfactory lobe (C) and the deep cerebellar nuclei (I, arrow). Extensive microglial reactivity along with localized tissue destruction is observed in the cerebellar lobes (F, where loss of calbindin staining is visible in the affected lobes) and VN (I). In contrast, only moderate activation is present surrounding the IO (L). (Scale bar, A–I.125 μm; J–L, 50 μm.)
Fig. 3.
Fig. 3.
Neuronal loss in affected brain areas of KO mice. (A–C) NeuN labeling (green) and Topro-3 counterstain (red) in the cerebellum of CT (A) and late-stage KO (B) mice. Colocalization of both labels is shown in yellow. (C) Quantification of NeuN-positive cells; the number of cells was reduced in lesion foci (KO lesion, representative area denoted by white rectangle), as well as in adjacent regions of the cerebellum (KO, black rectangle) of late-stage KO mice (B) compared with CT mice (A). *P < 0.05,*** P < 0.001 vs. CT. Topro-3–positive/NeuN-negative cells (probably microglia) were increased in lesioned areas of KO mice (B) (D–F) Significant decrease in NeuN-positive cells in the VN of KO mice (E) compared with CT mice (D and F for quantification), *P < 0.05 vs. CT. (G–I) Loss of NeuN-positive cells in the OB of late-stage KO mice (H) compared with CT mice (G, quantification in I). An increase in Topro-3–positive/NeuN-negative cells was observed in the OB of KO mice (H). **P < 0.01 vs. CT. (Scale bar, A–H, 100 μm.)
Fig. 4.
Fig. 4.
Oxidative stress and caspase-8 OB of KO mice. (A) Western blot analysis of protein carbonylation (Oxyblot), active caspase-9, active caspase-8, GFAP, and Iba-1 levels in OB of CT and KO mice. (B) Densitometric analysis of Western blot images in A. Integrated density values for each lane were normalized to β-actin and expressed relative to the lowest value in CT. ** P < 0.01, *** P < 0.001 vs. CT.
Fig. 5.
Fig. 5.
Light microscopy and EM changes in cerebellar cortex and OB of KO Mice. (A and B) Light microscopy demonstrates granular (gc), Purkinje (PC), and molecular layers (m) in (A) anterior and (B) posterior vermis. Spongiform degeneration (arrowheads) is evident only in the posterior lobules, in addition to vascular spaces, which exist in both areas. (C) Abnormal mitochondria with compact cristae (arrows; higher magnification in D) are present in presynaptic basket cell nerve termini adjacent to the cell body of a Purkinje cell (PC). (E) Intracellular edema with swelling and lysis of cytoplasmic organelles is evident in a degenerating neuronal cell body (N, nucleus) from the periglomerular external plexiform layer of the OB. (F, Inset) Swollen mitochondria (m) and a portion of a nucleus (N) at higher magnification. (Scale bars, A, 35 μm; B, 35 μm; C, 1 μm; D, 0.5 μm; E, 1 μm; F, 1 μm.)

Similar articles

Cited by

References

    1. Chol M, et al. The mitochondrial DNA G13513A MELAS mutation in the NADH dehydrogenase 5 gene is a frequent cause of Leigh-like syndrome with isolated complex I deficiency. J Med Genet. 2003;40:188–191. - PMC - PubMed
    1. Leigh D. Subacute necrotizing encephalomyelopathy in an infant. J Neurol Neurosurg Psychiatry. 1951;14:216–221. - PMC - PubMed
    1. Rahman S, et al. Leigh syndrome: Clinical features and biochemical and DNA abnormalities. Ann Neurol. 1996;39:343–351. - PubMed
    1. Munaro M, et al. A single cell complementation class is common to several cases of cytochrome c oxidase-defective Leigh's syndrome. Hum Mol Genet. 1997;6:221–228. - PubMed
    1. Piao YS, Tang GC, Yang H, Lu DH. Clinico-neuropathological study of a Chinese case of familial adult Leigh syndrome. Neuropathology. 2006;26:218–221. - PubMed

Publication types

MeSH terms

LinkOut - more resources