

C(alpha)-trace model of the transmembrane domain of human copper transporter 1, motion and functional implications
- PMID: 20534491
- PMCID: PMC2890728
- DOI: 10.1073/pnas.0914717107
C(alpha)-trace model of the transmembrane domain of human copper transporter 1, motion and functional implications
Abstract
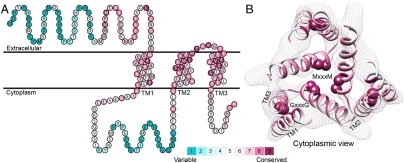
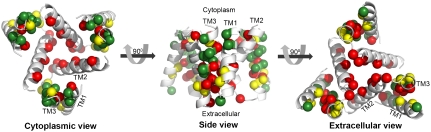
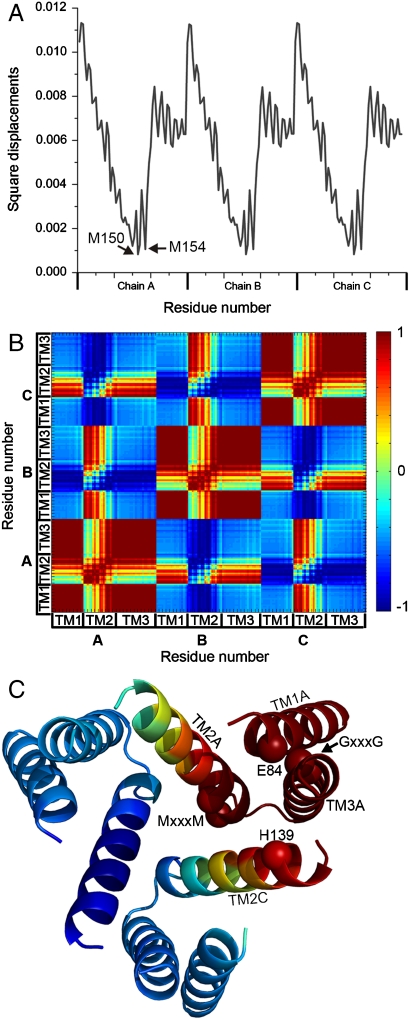
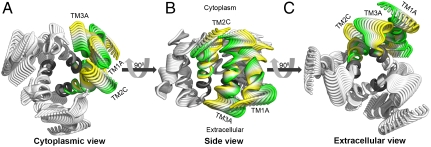
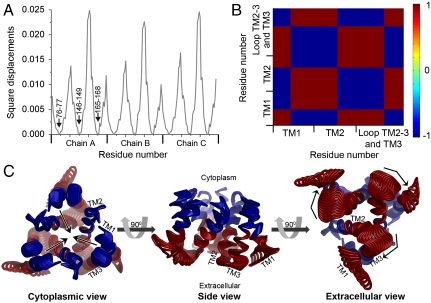
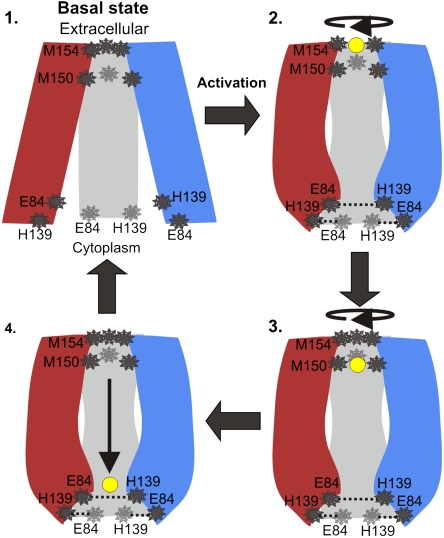
The trimeric human copper transporter 1 (hCTR1) is essential for copper uptake and is implicated in sensitivity to chemotherapy drugs. Using the cryoelectron microscopy (cryoEM) map of hCTR1 and evolutionary data, we constructed a Calpha-trace model of the membrane region. The model structure, supported by mutagenesis data, was used to investigate global dynamics through elastic network models. Identified as dominant hinge regions, hCTR1's MxxxM and GxxxG motifs were shown to have significant roles in functional movements characterized by the two slowest modes of motion. Both modes predicted significant changes at the wide cytoplasmic pore region; the slowest mode introduced a rotational motion around the pore central axis, whereas in the following mode the cytoplasmic parts of the helices approached and moved away from the pore center. In the most cooperative mode, the MxxxM motif in the extracellular narrow region remained static. The second mode of motion, however, predicted a cooperative rotational motion of this copper-binding motif, possibly reflecting activation at the pore's extracellular entrance. We suggest a molecular mechanism of copper transport in which this motif serves both as a gate and as a selectivity filter. We also suggest residues that are responsible for pH activation.
Conflict of interest statement
The authors declare no conflict of interest.
Figures
Similar articles
-
Mechanistic comparison of human high-affinity copper transporter 1-mediated transport between copper ion and cisplatin.Mol Pharmacol. 2009 Oct;76(4):843-53. doi: 10.1124/mol.109.056416. Epub 2009 Jul 1. Mol Pharmacol. 2009. PMID: 19570948 Free PMC article.
-
Three-dimensional structure of the human copper transporter hCTR1.Proc Natl Acad Sci U S A. 2009 Mar 17;106(11):4237-42. doi: 10.1073/pnas.0810286106. Epub 2009 Feb 24. Proc Natl Acad Sci U S A. 2009. PMID: 19240214 Free PMC article.
-
Self-Assembly of the Second Transmembrane Domain of hCtr1 in Micelles and Interaction with Silver Ion.J Phys Chem B. 2015 Jul 2;119(26):8302-12. doi: 10.1021/acs.jpcb.5b03744. Epub 2015 Jun 22. J Phys Chem B. 2015. PMID: 26061257
-
Emerging issues of connexin channels: biophysics fills the gap.Q Rev Biophys. 2001 Aug;34(3):325-472. doi: 10.1017/s0033583501003705. Q Rev Biophys. 2001. PMID: 11838236 Review.
-
A structural perspective on copper uptake in eukaryotes.Biometals. 2007 Jun;20(3-4):705-16. doi: 10.1007/s10534-006-9054-7. Epub 2007 Jan 9. Biometals. 2007. PMID: 17211682 Review.
Cited by
-
CTR1 silencing inhibits angiogenesis by limiting copper entry into endothelial cells.PLoS One. 2013 Sep 9;8(9):e71982. doi: 10.1371/journal.pone.0071982. eCollection 2013. PLoS One. 2013. PMID: 24039729 Free PMC article.
-
SLC31 (CTR) family of copper transporters in health and disease.Mol Aspects Med. 2013 Apr-Jun;34(2-3):561-70. doi: 10.1016/j.mam.2012.07.011. Mol Aspects Med. 2013. PMID: 23506889 Free PMC article. Review.
-
Copper in Gynecological Diseases.Int J Mol Sci. 2023 Dec 17;24(24):17578. doi: 10.3390/ijms242417578. Int J Mol Sci. 2023. PMID: 38139406 Free PMC article. Review.
-
Dynamical interplay between the human high-affinity copper transporter hCtr1 and its cognate metal ion.Biophys J. 2022 Apr 5;121(7):1194-1204. doi: 10.1016/j.bpj.2022.02.033. Epub 2022 Feb 22. Biophys J. 2022. PMID: 35202609 Free PMC article.
-
Copper trafficking in eukaryotic systems: current knowledge from experimental and computational efforts.Curr Opin Struct Biol. 2019 Oct;58:26-33. doi: 10.1016/j.sbi.2019.05.002. Epub 2019 Jun 6. Curr Opin Struct Biol. 2019. PMID: 31176065 Free PMC article. Review.
References
-
- Pena MM, Lee J, Thiele DJ. A delicate balance: homeostatic control of copper uptake and distribution. J Nutr. 1999;129(7):1251–1260. - PubMed
-
- DiDonato M, Sarkar B. Copper transport and its alterations in Menkes and Wilson diseases. Biochim Biophys Acta. 1997;1360(1):3–16. - PubMed
-
- Strausak D, Mercer JF, Dieter HH, Stremmel W, Multhaup G. Copper in disorders with neurological symptoms: Alzheimer’s, Menkes, and Wilson diseases. Brain Res Bull. 2001;55(2):175–185. - PubMed
-
- Zanusso G, et al. pH-dependent prion protein conformation in classical Creutzfeldt–Jakob disease. J Biol Chem. 2001;276(44):40377–40380. - PubMed
-
- Dumay QC, Debut AJ, Mansour NM, Saier MH., Jr The copper transporter (Ctr) family of Cu+ uptake systems. J Mol Microb Biotech. 2006;11(1–2):10–19. - PubMed
Publication types
MeSH terms
Substances
LinkOut - more resources
Full Text Sources
Other Literature Sources
Research Materials
