

Protein interface conservation across structure space
- PMID: 20534496
- PMCID: PMC2890749
- DOI: 10.1073/pnas.1005894107
Protein interface conservation across structure space
Abstract
With the advent of Systems Biology, the prediction of whether two proteins form a complex has become a problem of increased importance. A variety of experimental techniques have been applied to the problem, but three-dimensional structural information has not been widely exploited. Here we explore the range of applicability of such information by analyzing the extent to which the location of binding sites on protein surfaces is conserved among structural neighbors. We find, as expected, that interface conservation is most significant among proteins that have a clear evolutionary relationship, but that there is a significant level of conservation even among remote structural neighbors. This finding is consistent with recent evidence that information available from structural neighbors, independent of classification, should be exploited in the search for functional insights. The value of such structural information is highlighted through the development of a new protein interface prediction method, PredUs, that identifies what residues on protein surfaces are likely to participate in complexes with other proteins. The performance of PredUs, as measured through comparisons with other methods, suggests that relationships across protein structure space can be successfully exploited in the prediction of protein-protein interactions.
Conflict of interest statement
The authors declare no conflict of interest.
Figures
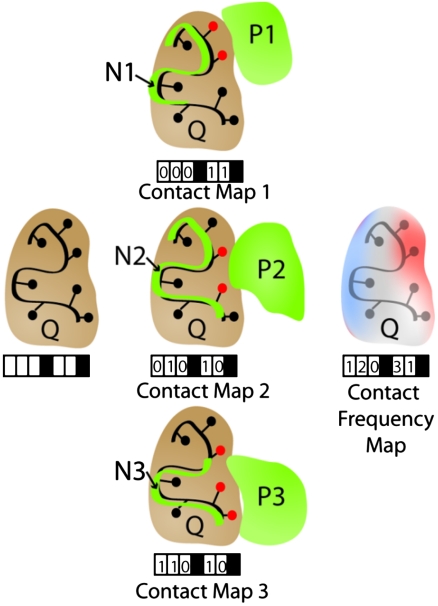
 of an atom of a surface residue of Q after applying the transformation, that residue is marked (red circles), generating a contact map for each structural neighbor (black boxes represent nonsurface residues that are not included). The “contact frequency map” is generated by summing the individual contact maps.
Similar articles
-
A quantitative analysis of interfacial amino acid conservation in protein-protein hetero complexes.J Bioinform Comput Biol. 2005 Oct;3(5):1137-50. doi: 10.1142/s0219720005001429. J Bioinform Comput Biol. 2005. PMID: 16278951
-
Predicting protein-protein interaction specificity through the integration of three-dimensional structural information and the evolutionary record of protein domains.Mol Biosyst. 2010 Apr;6(4):741-9. doi: 10.1039/b918395g. Epub 2010 Feb 23. Mol Biosyst. 2010. PMID: 20237652
-
A hybrid method for protein-protein interface prediction.Protein Sci. 2016 Jan;25(1):159-65. doi: 10.1002/pro.2744. Epub 2015 Jul 21. Protein Sci. 2016. PMID: 26178156 Free PMC article.
-
Evolution of protein interactions: from interactomes to interfaces.Arch Biochem Biophys. 2014 Jul 15;554:65-75. doi: 10.1016/j.abb.2014.05.010. Epub 2014 May 20. Arch Biochem Biophys. 2014. PMID: 24853495 Review.
-
Databases of protein-protein interactions and complexes.Methods Mol Biol. 2010;609:145-59. doi: 10.1007/978-1-60327-241-4_9. Methods Mol Biol. 2010. PMID: 20221918 Review.
Cited by
-
Mutual information and variants for protein domain-domain contact prediction.BMC Res Notes. 2012 Aug 31;5:472. doi: 10.1186/1756-0500-5-472. BMC Res Notes. 2012. PMID: 23244412 Free PMC article.
-
Predicting Protein-Protein Interactions from Matrix-Based Protein Sequence Using Convolution Neural Network and Feature-Selective Rotation Forest.Sci Rep. 2019 Jul 8;9(1):9848. doi: 10.1038/s41598-019-46369-4. Sci Rep. 2019. PMID: 31285519 Free PMC article.
-
Solution NMR structures provide first structural coverage of the large protein domain family PF08369 and complementary structural coverage of dark operative protochlorophyllide oxidoreductase complexes.J Struct Funct Genomics. 2013 Sep;14(3):119-26. doi: 10.1007/s10969-013-9159-5. Epub 2013 Aug 21. J Struct Funct Genomics. 2013. PMID: 23963952 Free PMC article.
-
STRING v9.1: protein-protein interaction networks, with increased coverage and integration.Nucleic Acids Res. 2013 Jan;41(Database issue):D808-15. doi: 10.1093/nar/gks1094. Epub 2012 Nov 29. Nucleic Acids Res. 2013. PMID: 23203871 Free PMC article.
-
Progress and challenges in predicting protein interfaces.Brief Bioinform. 2016 Jan;17(1):117-31. doi: 10.1093/bib/bbv027. Epub 2015 May 13. Brief Bioinform. 2016. PMID: 25971595 Free PMC article. Review.
References
-
- Salwinski L, Eisenberg D. Computational methods of analysis of protein-protein interactions. Curr Opin Struct Biol. 2003;13:377–382. - PubMed
Publication types
MeSH terms
Substances
Grants and funding
LinkOut - more resources
Full Text Sources
Other Literature Sources
