. 2010 Jun 22;107(25):11537-42.
doi: 10.1073/pnas.1001261107. Epub 2010 Jun 7.

Escherichia coli induces DNA damage in vivo and triggers genomic instability in mammalian cells

Affiliations

Escherichia coli induces DNA damage in vivo and triggers genomic instability in mammalian cells

Gabriel Cuevas-Ramos et al. Proc Natl Acad Sci U S A. .

Abstract

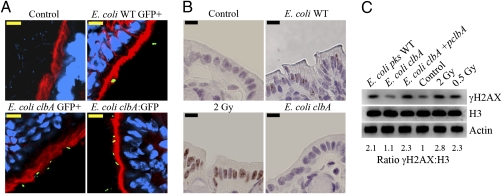
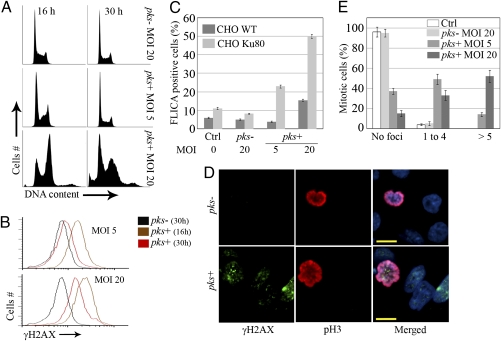
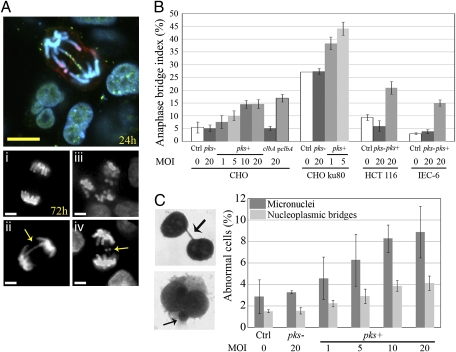
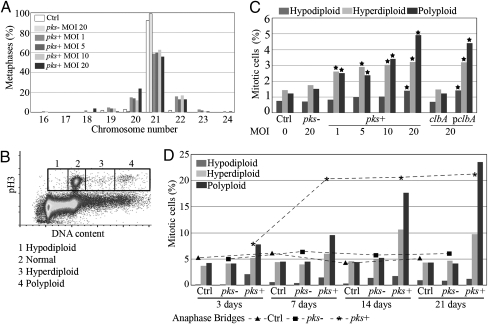
Escherichia coli is a normal inhabitant of the human gut. However, E. coli strains of phylogenetic group B2 harbor a genomic island called "pks" that codes for the production of a polyketide-peptide genotoxin, Colibactin. Here we report that in vivo infection with E. coli harboring the pks island, but not with a pks isogenic mutant, induced the formation of phosphorylated H2AX foci in mouse enterocytes. We show that a single, short exposure of cultured mammalian epithelial cells to live pks(+) E. coli at low infectious doses induced a transient DNA damage response followed by cell division with signs of incomplete DNA repair, leading to anaphase bridges and chromosome aberrations. Micronuclei, aneuploidy, ring chromosomes, and anaphase bridges persisted in dividing cells up to 21 d after infection, indicating occurrence of breakage-fusion-bridge cycles and chromosomal instability. Exposed cells exhibited a significant increase in gene mutation frequency and anchorage-independent colony formation, demonstrating the infection mutagenic and transforming potential. Therefore, colon colonization with these E. coli strains harboring the pks island could contribute to the development of sporadic colorectal cancer.


Conflict of interest statement

The authors declare no conflict of interest.

Figures

Fig. 1.
Fig. 1.
pks+ E. coli induces DSBs in vivo. Ligated colon loops were prepared in BALB/c mice, and then the loops were injected with sterile culture medium or with 3 × 10⁹ wild-type pks+ E. coli (WT), the isogenic clbA mutant impaired for biosynthesis by the NRPS-PKS enzymes, or the clbA mutant complemented with a plasmid-encoded clbA allele. After 6-h incubation, the loops were removed and processed for immunohistology or Western blot analysis. (A) Frozen tissue sections were stained for DNA (blue) and F-actin (red) and then were examined by confocal microcopy. Bacteria expressing GFP (constitutive promoter) or GFP under control of the clbA promoter (clbA:GFP) were detected in the green channel. (Scale bars, 10 μm.) (B) Paraffin tissue sections were stained for γH2AX (brown) and counterstained with hematoxylin. Gamma-irradiated mice (whole-body, 2 Gy) were used as positive controls. (Scale bars, 10 μm.) (C) Western blot analysis of γH2AX in colonocytes 6 h after inoculation of colon loops with wild-type pks+ E. coli, the clbA isogenic mutant, or the mutant complemented with a plasmid coding for clbA. Gamma-irradiated mice (whole-body, 2 or 0.5 Gy) were use as positive controls. Histone H3 and actin were probed as protein-loading controls. γH2AX levels relative to histone H3 content were estimated by densitometry.
Fig. 2.
Fig. 2.
DNA damage repair, cell death, and division after low-dose infection with pks+ E. coli. CHO cells were infected for 4 h with live pks+ or pks E. coli with an MOI of 5–20 bacteria per cell or were left uninfected (Ctrl). At the end of the infection, the cells were washed and grown with gentamicin. (A) Cell-cycle analysis 16 and 30 h after infection. (B) γH2AX levels were quantified by flow cytometry 16 or 30 h after infection. (C) CHO or xrs-6 Ku80-defective cells were infected; 24 h later, apoptotic cells were labeled with a carboxyfluorescein fluoromethyl ketone peptide inhibitor of caspases (FLICA) for 1 h and quantified by flow cytometry. Error bars represent SE from three experiments. (D) The cells were examined by confocal microscopy for DNA (blue), Ser10-phosphorylated histone H3 (pH3, red), and γH2AX (green) 24 h after infection. (Scale bars, 10 μm.) (E) Quantification of γH2AX foci in mitotic cells. Error bars represent SEs from three experiments.
Fig. 3.
Fig. 3.
Infection with pks+ E. coli induces anaphase bridges and micronuclei. (A) (Upper) Anaphase bridge 24 h after infection with pks+ E. coli (DNA shown in blue, γH2AX in green, and pH3 in red). (Lower) Seventy-two hours after infection (i) normal anaphase, (ii) anaphase bridge (arrow), (iii) multipolar mitosis, (iv) lagging chromosomes (arrow). (Scale bars, 10 μm.) (B) Anaphase bridge index in CHO, ku80-defective CHO, HCT-116, and IEC-6 cells 3 d after infection. (C) Cytochalasin-B–induced cytokinesis block assay. (Left) Images and arrows show a nucleoplasmic bridge (formed by anaphase bridging) and a micronucleus (formed by lagging or acentric chromosomes) in CHO cells 3 d after infection. (Right) Micronuclei and nucleoplasmic bridges were counted in 1,000 binucleated cells. Error bars in B and C represent the SE from three experiments.
Fig. 4.
Fig. 4.
Infection with pks+ E. coli induces aneuploidy and tetraploidy. (A) Chromosome counts in CHO cells 3 d after infection. At least 100 metaphase spreads were examined in each group. (B) Aneuploidy assay by flow cytometry (16). At least 2 × 10⁵ mitotic (Ser10-phosphorylated histone H3-positive) cells were analyzed for DNA content. Normal (4n), hypodiploid (<4n), hyperdiploid (4 < n < 8) and polyploid (8n) cells were gated and counted. (C) Three days after infection (MOI of 1–20), CHO cells were analyzed for aneuploidy as in B. *, P < 0.001, exact Fisher's test. Similar results were found with IEC-6 and HCT-116 cells (Table S1). (D) Cells were infected (MOI = 20) and then were grown for 21 d (with six passages). Aneuploidy (histograms) was assessed as in B, and the anaphase bridge index (curves) was scored as in Fig 2B.

Comment in

Similar articles

Cited by

References

    1. Neish AS. Microbes in gastrointestinal health and disease. Gastroenterology. 2009;136:65–80. - PMC - PubMed
    1. Escobar-Páramo P, et al. Large-scale population structure of human commensal Escherichia coli isolates. Appl Environ Microbiol. 2004;70:5698–5700. - PMC - PubMed
    1. Nowrouzian FL, Wold AE, Adlerberth I. Escherichia coli strains belonging to phylogenetic group B2 have superior capacity to persist in the intestinal microflora of infants. J Infect Dis. 2005;191:1078–1083. - PubMed
    1. Nougayrède JP, et al. Escherichia coli induces DNA double-strand breaks in eukaryotic cells. Science. 2006;313:848–851. - PubMed
    1. Putze J, et al. Genetic structure and distribution of the colibactin genomic island among members of the family Enterobacteriaceae. Infect Immun. 2009;77:4696–4703. - PMC - PubMed

Publication types