. 2010 Jun 22;107(25):11417-22.
doi: 10.1073/pnas.1003042107. Epub 2010 Jun 7.

Regulation of Golgi structure and secretion by receptor-induced G protein βγ complex translocation

Affiliations

Regulation of Golgi structure and secretion by receptor-induced G protein βγ complex translocation

Deepak Kumar Saini et al. Proc Natl Acad Sci U S A. .

Abstract

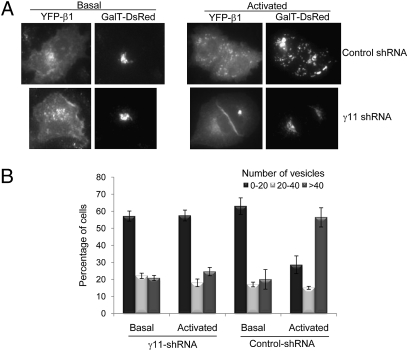
We show that receptor induced G protein betagamma subunit translocation from the plasma membrane to the Golgi allows a receptor to initiate fragmentation and regulate secretion. A lung epithelial cell line, A549, was shown to contain an endogenous translocating G protein gamma subunit and exhibit receptor-induced Golgi fragmentation. Receptor-induced Golgi fragmentation was inhibited by a shRNA specific to the endogenous translocating gamma subunit. A kinase defective protein kinase D and a phospholipase C beta inhibitor blocked receptor-induced Golgi fragmentation, suggesting a role for this process in secretion. Consistent with betagamma translocation dependence, fragmentation induced by receptor activation was inhibited by a dominant negative nontranslocating gamma3. Insulin secretion was shown to be induced by muscarinic receptor activation in a pancreatic beta cell line, NIT-1. Induction of insulin secretion was also inhibited by the dominant negative gamma3 subunit consistent with the Golgi fragmentation induced by betagamma complex translocation playing a role in secretion.


Conflict of interest statement

The authors declare no conflict of interest.

Figures

Fig. 1.
Fig. 1.
Golgi fragmentation visualized by immunofluorescence using antibodies to endogenous Golgi marker. (A) TGN marker, TGN46. HeLa cells expressing M3 receptor, αq, and GFP-γ11 probed with anti-TGN46 antibody. Representative images are shown (n > 90 from three to four independent experiments). (Left) GFP-γ11 expression, (Right) TGN46 distribution. (Upper) Basal unstimulated cells; (Lower) cells treated with 100 μM carbachol for 2.5 h. Note that in activated cells, TGN46 is completely redistributed and small vesicles can be seen (A Lower). (B) Bar graph depicting the percentage of cells (±SEM) showing compact or fragmented distribution of TGN46 based on the experiment described above in A.
Fig. 2.
Fig. 2.
Fragmentation induced by the translocation of an endogenous γ subunit. (A) Trans-Golgi fragmentation induced by M3 receptor activation in A549 cells. (Left) Basal state and (Right) receptor activated state. Images on the Left are of YFP tagged G protein subunit. Images on Right are of GalT-DsRed in the same cell. (B) Bar diagram representing the percentage of cells (± SEM) that contained the vesicle numbers shown above the plots. Total cells analyzed range from 250 to 800 from 5 to 10 independent experiments.
Fig. 3.
Fig. 3.
Inhibition of receptor-induced Golgi fragmentation by γ11 shRNA. A549 cells expressing M3 receptor, αq, YFP-β1, GalT-DsRed, and γ11-shRNA or nontarget control shRNA as indicated were used. Cells were stimulated with 100 μM carbachol for 2.5 h. Cells were imaged as described in Material and Methods. (A) Images of cells show presence of compact or fragmented Golgi. (Left) Basal state and (Right) receptor activated state. Images on Left are of YFP tagged G protein subunit. Images on Right are of GalT-DsRed in the same cell. (B) Bar diagram represents the percentage of cells that contained the vesicle numbers shown above the plots. Total cells analyzed range from 100 to 200 from three to five independent experiments.
Fig. 4.
Fig. 4.
Effect of a kinase defective PKD and a PLCβ inhibitor on Golgi fragmentation in A549 cells. (Left) YFP-γ11 subunit and (Right) GalT-DsRed in the same cell. (A) Effect of a kinase dead PKD1 mutant after receptor activation in the presence of γ11. Images were captured after M3 receptor activation. (B) Effect of U73122 (PLCβ) inhibitor and its inactive analog U73343 after receptor activation in the presence of γ11. (C) Bar diagrams depicting the effect of receptor activation in the presence of various inhibitors. The cells expressing the indicated G protein subunits tagged with YFP were scored for the expression pattern of GalT-DsRed as described in Fig. 2C. Total cells analyzed range from 250 to 500 in from three to six independent experiments. A549 cells expressing M3 receptor, αq, YFP-γ11 were used. The cells were activated with carbachol for 2.5 h (U73122, PLCβ inhibitor; U73343, inactive analog for PLCβ inhibitor).
Fig. 5.
Fig. 5.
Regulation of secretion by receptor-mediated translocation of the G protein βγ complex. (A) Muscarinic receptor stimulation of insulin secretion in NIT-1 cells is inhibited by a dominant negative nontranslocating γ subunit. NIT-1 pancreatic β cells were mock transfected (control) or transfected with the nontranslocating γ3 subunit (γ3). Insulin secreted by NIT-1 cells with and without receptor activation was assayed as described in Materials and Methods. The fold induction in insulin secreted from various cells was calculated with respect to basal levels from control cells (n > 6); **P ≤ 0.001. (B) Effect of dominant negative γ3 on trans-Golgi fragmentation in NIT-1 cells. NIT-1 cells were transiently transfected with YFP alone or YFP-γ3 and GalT-DsRed for 24 h. The cells were then imaged using Andor Revolution–Leica spinning disk confocal microscope system. The 3D images of the trans-Golgi were obtained by Z stacking GalT-DsRed expressing cells using Andor IQ software. (Left) Confocal image of cells expressing YFP, (Right) collapsed Z-stack image of the GalT-DsRed expression from the same cell. The total number of cells showing either compact or fragmented Golgi were counted and are depicted in the bar diagram, n = 3 (>50 cells each experiment). (C) Model for regulation of Golgi structure and secretion by an extracellular signal. GPCR stimulation by an agonist leads to the translocation of the βγ complex to the Golgi from the plasma membrane where it mediates secretory vesicle traffic from the trans-Golgi network to the plasma membrane (arrow).

Similar articles

Cited by

References

    1. Saini DK, Kalyanaraman V, Chisari M, Gautam N. A family of G protein betagamma subunits translocate reversibly from the plasma membrane to endomembranes on receptor activation. J Biol Chem. 2007;282:24099–24108. - PMC - PubMed
    1. Akgoz M, Kalyanaraman V, Gautam N. Receptor-mediated reversible translocation of the G protein betagamma complex from the plasma membrane to the Golgi complex. J Biol Chem. 2004;279:51541–51544. - PubMed
    1. Saini DK, Chisari M, Gautam N. Shuttling and translocation of heterotrimeric G proteins and Ras. Trends Pharmacol Sci. 2009;30:278–286. - PMC - PubMed
    1. Wilson BS, Komuro M, Farquhar MG. Cellular variations in heterotrimeric G protein localization and expression in rat pituitary. Endocrinology. 1994;134:233–244. - PubMed
    1. Gleeson PA, Lock JG, Luke MR, Stow JL. Domains of the TGN: Coats, tethers and G proteins. Traffic. 2004;5:315–326. - PubMed

Publication types

LinkOut - more resources