. 2010 Jun 22;107(25):11549-54.
doi: 10.1073/pnas.0912426107. Epub 2010 Jun 7.

Enhanced hepatitis C virus genome replication and lipid accumulation mediated by inhibition of AMP-activated protein kinase

Affiliations

Enhanced hepatitis C virus genome replication and lipid accumulation mediated by inhibition of AMP-activated protein kinase

Jamel Mankouri et al. Proc Natl Acad Sci U S A. .

Abstract

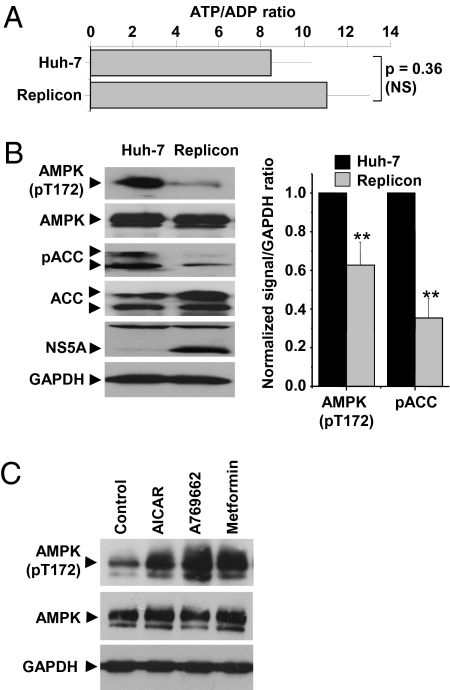
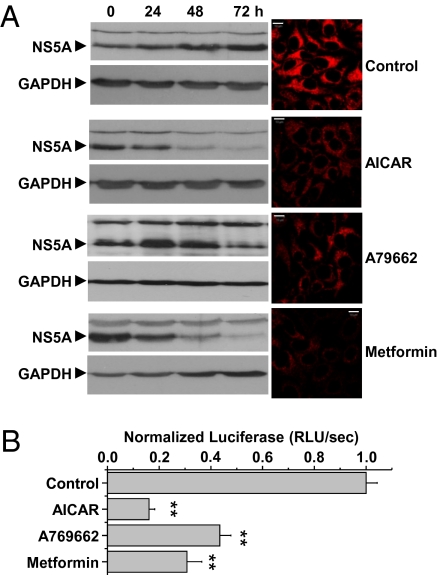
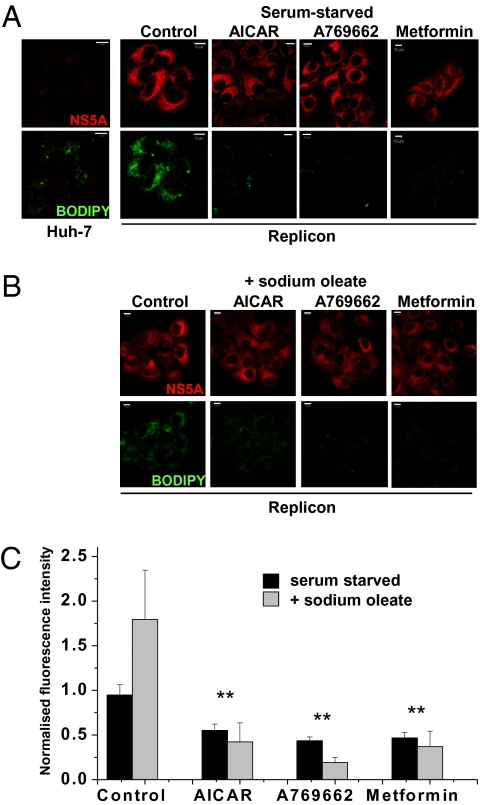
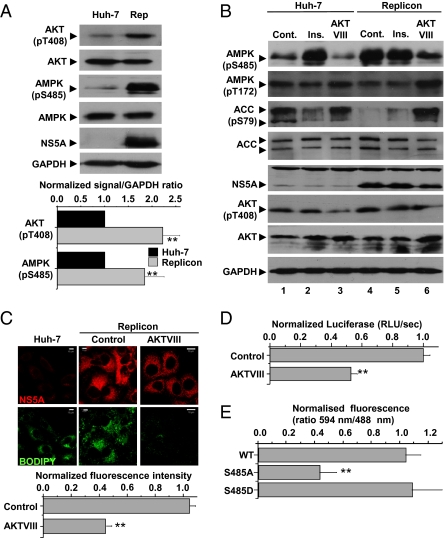
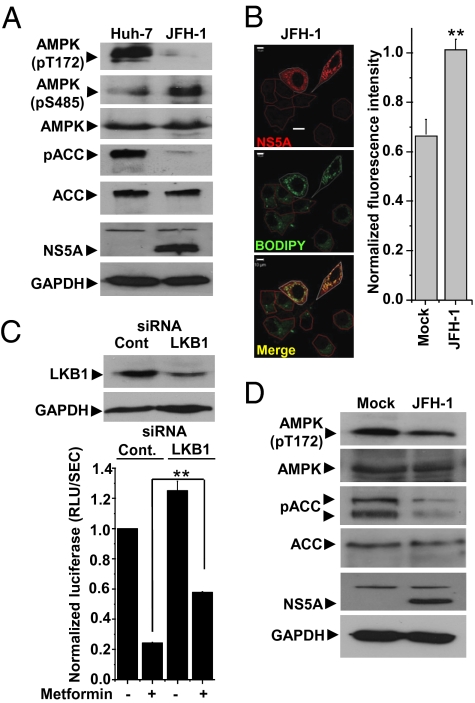
Hepatitis C virus (HCV) infection is associated with dysregulation of both lipid and glucose metabolism. As well as contributing to viral replication, these perturbations influence the pathogenesis associated with the virus, including steatosis, insulin resistance, and type 2 diabetes. AMP-activated protein kinase (AMPK) plays a key role in regulation of both lipid and glucose metabolism. We show here that, in cells either infected with HCV or harboring an HCV subgenomic replicon, phosphorylation of AMPK at threonine 172 and concomitant AMPK activity are dramatically reduced. We demonstrate that this effect is mediated by activation of the serine/threonine kinase, protein kinase B, which inhibits AMPK by phosphorylating serine 485. The physiological significance of this inhibition is demonstrated by the observation that pharmacological restoration of AMPK activity not only abrogates the lipid accumulation observed in virus-infected and subgenomic replicon-harboring cells but also efficiently inhibits viral replication. These data demonstrate that inhibition of AMPK is required for HCV replication and that the restoration of AMPK activity may present a target for much needed anti-HCV therapies.


Conflict of interest statement

The authors declare no conflict of interest.

Figures

Fig. 1.
Fig. 1.
Inhibition of AMPK activity in cells harboring the HCV subgenomic replicon. (A) ATP/ADP ratio was measured as described to assess AMP/ATP indirectly (n = 3). NS, not significant. (B) Cell lysates resolved by SDS/PAGE were immunoblotted with the indicated antibodies (Left). Levels of phosphorylated AMPK or ACC were quantified by densitometry in comparison with GAPDH (n = 3) (Right). All error bars indicate mean ± SEM. **Significant difference from Huh-7 (P < 0.05). (C) Replicon cells were left untreated (Control) or treated with AICAR (1 mM), A769662 (100 μM), or metformin (1 mM) for 4 h before immunoblot analysis with the indicated antibodies.
Fig. 2.
Fig. 2.
AMPK activation inhibits HCV replication. (A) Replicon cells were left untreated (Control) or treated with AICAR (1 mM), A769662 (100 μM), or metformin (1 mM) for 0, 24, 48, and 72 h, and replicon replication was assessed by immunoblotting for NS5A (Left). NS5A immunofluorescence was performed at 72 h posttransfection (Right). Identical settings were maintained for image capture. Representative confocal images are shown. (Scale bars, 10 μm.) (B) Cells transfected with in vitro transcripts of a luciferase subgenomic replicon (genotype 1b) were treated with the indicated AMPK agonists overnight. Luciferase activity was used as a measure of replication. Error bars indicate mean ± SEM. **Significant difference from control (P < 0.05).
Fig. 3.
Fig. 3.
Effect of AMPK activators on lipid abundance. (A and B) Abundance of NS5A or cellular lipids (BODIPY) was evaluated in Huh-7 or replicon cells incubated in serum-free medium (A) or supplemented with sodium oleate (B). Cells were stained for lipid content with BODIPY dye for 1 h after NS5A labeling. Identical settings were maintained for image capture. Representative confocal images are shown. (Scale bars, 10 μm.) Replicon cells were treated with AMPK agonists for 4 h before processing. (C) For quantification of lipid abundance, images were captured and analyzed using Imaris software. Values were normalized to the control BODIPY levels minus oleate. Error bars indicate mean ± SEM. **Significant difference from Huh-7 (P < 0.05).
Fig. 4.
Fig. 4.
Activation of AKT in replicon cells. (A) Cell lysates were analyzed by immunoblotting with the indicated antibodies. Levels of phosphorylated AKT or AMPK were quantified by densitometry in comparison with GAPDH (n = 3). **Significant difference from Huh-7 (P < 0.05). (B) Cell lysates were analyzed by immunoblotting with the indicated antibodies. Lanes 2 and 5: insulin (Ins) treatment (100 nM) for 4 h before harvest; lanes 3 and 6: AKTVIII treatment (5 μM) for 4 h before harvest. Cont, control. (C) Abundance of NS5A or lipids (BODIPY) was evaluated in untreated Huh-7 or replicon cells following treatment with AKTVIII (5 μM) for 4 h. For quantification of lipid abundance, images were captured and analyzed using Imaris software. **Significant difference from Huh-7 (P < 0.05). (D) Cells transfected with in vitro transcripts of a luciferase subgenomic replicon (genotype 1b) were treated with AKTVIII (5 μM) overnight. Luciferase activity [relative luminescence units (RLU)/sec] was used as a measure of replication. **Significant difference from control (P < 0.05). (E) Replicon cells were transiently transfected with plasmids expressing Myc-tagged wild-type, S485A or S485D AMPKα. At 48 h posttransfection, expression of both exogenous AMPKα and NS5A was detected by immunofluorescence with the appropriate antibodies. The ratio of fluorescence at 594 nm (AMPKα) to 494 nm (NS5A) was quantitated for 15 cells per condition using ImageJ software. All error bars indicate mean ± SEM. **Significant difference from wild-type (WT) AMPK (P < 0.05).
Fig. 5.
Fig. 5.
Inhibition of AMPK activity is observed in cells transfected with full-length JFH-1 RNA or infected with JFH-1 virus. (A) Cells were electroporated with full-length JFH-1 RNA and analyzed for AMPK activation status as described in Fig 1B. (B) Abundance of NS5A or cellular lipids (BODIPY) was analyzed as described in Fig. 3. JFH-1 transfected cells are outlined in white; untransfected cells in the same field are outlined in red. For quantification of lipid abundance, images were captured and analyzed using Imaris software. **Significant difference from untransfected (Mock) cells (P < 0.05). (C) Cells were electroporated with either control (Cont) or LKB-1–specific siRNA, incubated for 72 h to allow silencing of the target gene, and then transfected with J6/JFH-1Luc RNA. Samples at 48 h posttransfection were analyzed for luciferase activity. Metformin was added to cells at 24 h posttransfection. Cell lysates were analyzed by immunoblotting with the indicated antibodies to confirm LKB1 silencing. Results are expressed as mean ± SEM (n = 3). **Significant difference from untreated (P < 0.05). (D) Huh-7 cells were mock-infected or infected with JFH-1 virus at a multiplicity of infection of 0.5 focus-forming units per cell. Cell lysates were prepared at 48 h posttransfection and analyzed by immunoblotting with the indicated antibodies.

Similar articles

Cited by

References

    1. Shepard CW, Finelli L, Alter MJ. Global epidemiology of hepatitis C virus infection. Lancet Infect Dis. 2005;5:558–567. - PubMed
    1. Moradpour D, Penin F, Rice CM. Replication of hepatitis C virus. Nat Rev Microbiol. 2007;5:453–463. - PubMed
    1. McLauchlan J. Lipid droplets and hepatitis C virus infection. Biochim Biophys Acta. 2009;1791:552–559. - PubMed
    1. Gastaminza P, et al. Cellular determinants of hepatitis C virus assembly, maturation, degradation, and secretion. J Virol. 2008;82:2120–2129. - PMC - PubMed
    1. Kapadia SB, Barth H, Baumert T, McKeating JA, Chisari FV. Initiation of hepatitis C virus infection is dependent on cholesterol and cooperativity between CD81 and scavenger receptor B type I. J Virol. 2007;81:374–383. - PMC - PubMed

Publication types