. 2010 Nov;31(22):2765-73.
doi: 10.1093/eurheartj/ehq167. Epub 2010 Jun 9.

Circulating microRNAs are new and sensitive biomarkers of myocardial infarction

Affiliations

Circulating microRNAs are new and sensitive biomarkers of myocardial infarction

Yuri D'Alessandra et al. Eur Heart J. 2010 Nov.

Abstract

Aims: Circulating microRNAs (miRNAs) may represent a novel class of biomarkers; therefore, we examined whether acute myocardial infarction (MI) modulates miRNAs plasma levels in humans and mice.

Methods and results: Healthy donors (n = 17) and patients (n = 33) with acute ST-segment elevation MI (STEMI) were evaluated. In one cohort (n = 25), the first plasma sample was obtained 517 ± 309 min after the onset of MI symptoms and after coronary reperfusion with percutaneous coronary intervention (PCI); miR-1, -133a, -133b, and -499-5p were ~15- to 140-fold control, whereas miR-122 and -375 were ~87-90% lower than control; 5 days later, miR-1, -133a, -133b, -499-5p, and -375 were back to baseline, whereas miR-122 remained lower than control through Day 30. In additional patients (n = 8; four treated with thrombolysis and four with PCI), miRNAs and troponin I (TnI) were quantified simultaneously starting 156 ± 72 min after the onset of symptoms and at different times thereafter. Peak miR-1, -133a, and -133b expression and TnI level occurred at a similar time, whereas miR-499-5p exhibited a slower time course. In mice, miRNAs plasma levels and TnI were measured 15 min after coronary ligation and at different times thereafter. The behaviour of miR-1, -133a, -133b, and -499-5p was similar to STEMI patients; further, reciprocal changes in the expression levels of these miRNAs were found in cardiac tissue 3-6 h after coronary ligation. In contrast, miR-122 and -375 exhibited minor changes and no significant modulation. In mice with acute hind-limb ischaemia, there was no increase in the plasma level of the above miRNAs.

Conclusion: Acute MI up-regulated miR-1, -133a, -133b, and -499-5p plasma levels, both in humans and mice, whereas miR-122 and -375 were lower than control only in STEMI patients. These miRNAs represent novel biomarkers of cardiac damage.


Figures

Figure 1
Figure 1
MicroRNAs plasma levels in patients with ST-segment elevation myocardial infarction (Group 1). (AD) miR-1, -133a, -133b, and -499-5p exhibited a 15- to 140-fold increase in plasma samples collected 517 ± 309 min after the onset of myocardial infarction symptoms, i.e. Day 0. At Day 5 after myocardial infarction, these microRNAs were back to levels comparable to those in healthy subjects. (E and F) At Day 0, miR-122 (E) and miR-375(F) were lower than in control subjects and miR-122 level remained below control both at Day 5 and at Day 30. (Control healthy subjects = 17; ST-segment elevation myocardial infarction patients = 25 at Day 0; 7 at Day 5 and 7 at Day 30. Values indicate fold changes of each microRNA vs. its level in control healthy subjects, arbitrarily set at 1 as indicated by the red bar; yellow bars indicate microRNA values after myocardial infarction; results are reported as mean ± SEM; *P < 0.01; §P < 0.05 vs. control; NS, not significant.)
Figure 2
Figure 2
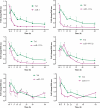
Time course of microRNAs plasma levels and TnI in patients with ST-segment elevation myocardial infarction (Group 2). In these patients, the first plasma sample was obtained 156 ± 72 min after the onset of symptoms (T0); other samples were obtained at different times thereafter, as indicated. miR-1, -133a, and -133b achieved their peak before troponin I, whereas miR-499-5p exhibited a slower time course. The data have been normalized to the peak level that each microRNA and troponin I achieved in each patient and the time of the peak-fold increase vs. healthy control was not identical among patients. On the average, miR-1 achieved a 48.3 ± 17.4-fold peak at T0; miR-133a achieved a 5426 ± 3047-fold peak at T0; miR-133b achieved a 312.2 ± 182.6-fold peak at T0; miR 499-5p achieved a 299.1 ± 106.4-fold peak at 9 h. miR-122 and -375 were never above control; their lowest level was 0.26 ± 0.12 and 0.53 ± 0.10 control and occurred at the 45 and 33 h time points, respectively. Troponin I peak increase of 1066 ± 200-fold was achieved at the 3 h time point. (Control healthy subjects = 17; ST-segment elevation myocardial infarction patients = 5–8 at each time point; results for each microRNA and troponin I are reported as mean ± SEM; *P < 0.01; §P < 0.05 vs. control.)
Figure 3
Figure 3
Time course of microRNAs plasma levels and troponin I in mice with acute myocardial infarction. miR-1, -133a, and -133b achieved their peak either at the 6 or the 18 h time point. In contrast, miR-499-5p achieved its peak 24 h after coronary occlusion. Changes in miR-122 and -375 were minor. It is noteworthy that the magnitude of the increase was highest for miR-499-5p and that this microRNA, 15 min to 6 h after coronary occlusion, closely paralleled the increase in troponin I which was monitored in a separate group of animals. Fold changes were calculated against the mean value of the sham at each time point (for microRNAs, at each time point, n = 4–5 both for myocardial infarction and sham-operated mice; for troponin I, n = 5 at each time point from 15 to 180 min and n = 2 at each time point from 6 to 24 h; results for each microRNA and troponin I are reported as mean ± SEM; NS, not significant; *P < 0.01, §P < 0.05 vs. sham-operated control mice.) Red bars indicate sham controls at each time point, arbitrarily set at 1; yellow bars indicate microRNA values at each time point after myocardial infarction; and blue bars indicate troponin I values after myocardial infarction.
Figure 4
Figure 4
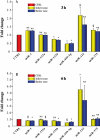
MicroRNAs cardiac levels in mice with acute myocardial infarction. The cardiac expression level of miR-1, -133a, -133b, -499-5p, -122, and -375 was evaluated in the border zone and infarct area of mice, 3 and 6 hr following coronary artery ligation, as well as in the left ventricle of sham-operated mice at the same time points. miR-499-5p exhibited a decrease at both time points, both in the infarct and border zones. miR-1, -133a, and -133b decreased, either in the border area, the infarct, or both, and this response was apparent either 3 or 6 h after coronary occlusion. Interestingly, miR-122 exhibited an increase in the infarct both 3 and 6 h after coronary occlusion. miR-375 exhibited a minor increase in the infarct area which was apparent only at the 3 h time point (at each time point, n = 4–5 for myocardial infarction and n = 4–5 for sham operated; results for each microRNA are reported as mean ± SEM; NS, not significant; *P < 0.01, §P < 0.05 vs. sham-operated control mice.) Control values were arbitrarily set at 1 as indicated by the red bar.
Figure 5
Figure 5
MicroRNAs plasma levels in mice with acute hind-limb ischaemia. miR-1, -133a, -133b, -499-5p, -122, and -375 plasma levels were evaluated in mice with acute hind-limb ischaemia, 6 and 24 h after femoral artery dissection. At 6 h, miR-1, -133a, and -133b exhibited a marked decrease, whereas miR-375 increased; all microRNAs were back to control value at 24 h. In contrast, miR-499-5p and miR-122 exhibited no significant change. (n = 5 for hind-limb ischaemia and n = 5 for sham operated; values indicate fold changes of each microRNA vs. sham-operated mice; results for each microRNA are reported as mean ± SEM; NS, not significant; §P < 0.05). Control values were arbitrarily set to 1 as indicated by the red bar.

Comment in

Similar articles

Cited by

References

    1. Bartel DP. MicroRNAs: genomics, biogenesis, mechanism, and function. Cell. 2004;116:281–297. doi:10.1016/S0092-8674(04)00045-5. - DOI - PubMed
    1. miRBase, release 14.0. http://microrna.sanger.ac.uk . (September 2009)
    1. Shan ZX, Lin QX, Fu YH, Deng CY, Zhou ZL, Zhu JN, Liu XY, Zhang YY, Li Y, Lin SG, Yu XY. Upregulated expression of miR-1/miR-206 in a rat model of myocardial infarction. Biochem Biophys Res Commun. 2009;381:597–601. doi:10.1016/j.bbrc.2009.02.097. - DOI - PubMed
    1. Van Rooij E, Sutherland LB, Thatcher JE, DiMaio JM, Naseem RH, Marshall WS, Hill JA, Olson EN. Dysregulation of microRNAs after myocardial infarction reveals a role of miR-29 in cardiac fibrosis. Proc Natl Acad Sci USA. 2008;105:13027–13032. doi:10.1073/pnas.0805038105. - DOI - PMC - PubMed
    1. Dong S, Cheng Y, Yang J, Li J, Liu X, Wang X, Wang D, Krall TJ, Delphin ES, Zhang C. MicroRNA expression signature and the role of microRNA-21 in the early phase of acute myocardial infarction. J Biol Chem. 2009;284:29514–29525. doi:10.1074/jbc.M109.027896. - DOI - PMC - PubMed

Publication types