

The natural history of multiple sclerosis: a geographically based study 10: relapses and long-term disability
- PMID: 20534650
- PMCID: PMC2892939
- DOI: 10.1093/brain/awq118
The natural history of multiple sclerosis: a geographically based study 10: relapses and long-term disability
Abstract
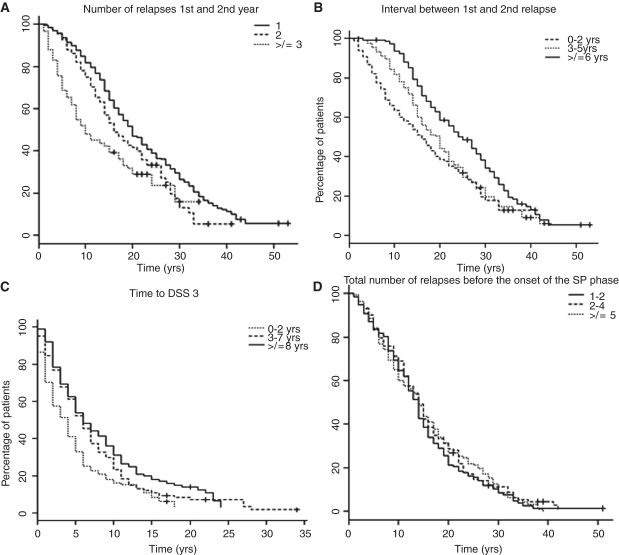
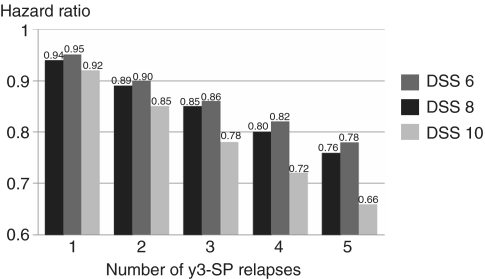
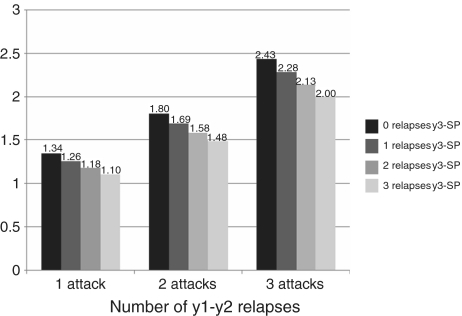
The relationship of relapses to long-term disability in multiple sclerosis is uncertain. Relapse reduction is a common therapeutic target but clinical trials have shown dissociation between relapse suppression and disability accumulation. We investigated relationships between relapses and disability progression for outcomes of requiring assistance to walk, being bedridden and dying from multiple sclerosis [Disability Status Scale 6, 8, 10] by analysing 28 000 patient-years of evolution in 806-bout onset patients from the London Ontario natural history cohort. Having previously shown no effect of relapse frequency among progressive multiple sclerosis subtypes, here we examined these measures in the pre-progressive or relapsing-remitting phase. Survival was compared among groups stratified by (i) early relapses--number of attacks during the first 2 years of multiple sclerosis; (ii) length of first inter-attack interval; (iii) interval between onset and Disability Status Scale 3 (moderate disability); (iv) number of attacks from the third year of disease up to onset of progression; and (v) during the entire relapsing-remitting phase. Early clinical features can predict hard disability outcomes. Frequent relapses in the first 2 years and shorter first inter-attack intervals predicted shorter times to reach hard disability endpoints. Attack frequencies, in the first 2 years, of 1 versus >or=3, gave differences of 7.6, 12.8 and 20.3 years in times from disease onset to Disability Status Scale 6, 8 and 10, respectively. Time to Disability Status Scale 3 highly and independently predicted time to Disability Status Scale 6, 8 and 10. In contrast, neither total number of relapsing-remitting phase attacks nor of relapses experienced during the relapsing-remitting phase after the second year up to onset of progression showed a deleterious effect on times from disease onset, from progression onset and from Disability Status Scale 3 to these hard endpoints. The failure of a regulatory mechanism tied to neurodegeneration is suggested. Relapse frequency beyond Year 2 does not appear to predict the key outcome of secondary progression or times to Disability Status Scale 6, 8 or 10, highlighting two distinct disease phases related to late outcome. These appear to be separated by a watershed within the relapsing-remitting phase, just a few years after clinical onset. Higher early relapse frequencies and shorter first inter-attack intervals herald more rapid deterioration via interaction with the neurodegeneration characterizing secondary progression. They increase the probability of its occurrence, its latency and influence--to a lesser degree--its slope. The prevention or delay of the progressive phase of the disease is implicated as a key therapeutic target in relapsing-remitting patients.
Figures
Comment in
-
Predicting a window of therapeutic opportunity in multiple sclerosis.Brain. 2010 Jul;133(Pt 7):1863-5. doi: 10.1093/brain/awq182. Brain. 2010. PMID: 20584943 Review. No abstract available.
References
-
- Bjartmar C, Kinkel RP, Kidd G, Rudick RA, Trapp BD. Axonal loss in normal-appearing white matter in a patient with acute multiple sclerosis. Neurology. 2001;57:1248–52. - PubMed
-
- Broman T, Andersen O, Bergmann L. Clinical studies on multiple sclerosis. I. Presentation of an incidence material from Gothenburg. Acta Neurol Scand. 1981;63:6–33. - PubMed
-
- Coles AJ, Wing MG, Molyneux P, Paolillo A, Davie CM, Hale G, et al. Monoclonal antibody treatment exposes three mechanisms underlying the clinical course of multiple sclerosis. Ann Neurol. 1999;46:296–304. - PubMed
-
- Confavreux C, Aimard G, Devic M. Course and prognosis of multiple sclerosis assessed by the computerized data processing of 349 patients. Brain. 1980;103:281–300. - PubMed
Publication types
MeSH terms
Grants and funding
LinkOut - more resources
Full Text Sources
Other Literature Sources
Medical
