. 2010 Oct;20(10):2287-303.
doi: 10.1093/cercor/bhq069. Epub 2010 Jun 9.

Cell type-specific thalamic innervation in a column of rat vibrissal cortex

Affiliations

Cell type-specific thalamic innervation in a column of rat vibrissal cortex

Hanno S Meyer et al. Cereb Cortex. 2010 Oct.

Abstract

This is the concluding article in a series of 3 studies that investigate the anatomical determinants of thalamocortical (TC) input to excitatory neurons in a cortical column of rat primary somatosensory cortex (S1). We used viral synaptophysin-enhanced green fluorescent protein expression in thalamic neurons and reconstructions of biocytin-labeled cortical neurons in TC slices to quantify the number and distribution of boutons from the ventral posterior medial (VPM) and posteromedial (POm) nuclei potentially innervating dendritic arbors of excitatory neurons located in layers (L)2-6 of a cortical column in rat somatosensory cortex. We found that 1) all types of excitatory neurons potentially receive substantial TC input (90-580 boutons per neuron); 2) pyramidal neurons in L3-L6 receive dual TC input from both VPM and POm that is potentially of equal magnitude for thick-tufted L5 pyramidal neurons (ca. 300 boutons each from VPM and POm); 3) L3, L4, and L5 pyramidal neurons have multiple (2-4) subcellular TC innervation domains that match the dendritic compartments of pyramidal cells; and 4) a subtype of thick-tufted L5 pyramidal neurons has an additional VPM innervation domain in L4. The multiple subcellular TC innervation domains of L5 pyramidal neurons may partly explain their specific action potential patterns observed in vivo. We conclude that the substantial potential TC innervation of all excitatory neuron types in a cortical column constitutes an anatomical basis for the initial near-simultaneous representation of a sensory stimulus in different neuron types.


Figures
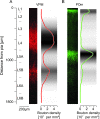
Figure 1.
Figure 1.
Thalamocortical bouton density profiles in a column. (A) Maximum intensity projection image of a confocal mosaic scan of a thalamocortical slice showing thalamic boutons from the VPM nucleus in a cortical column visualized by virus-expressed synaptophysin-coupled EGFP (left panel). A barrel column in the region above the hippocampal CA3 pole/fornix was selected for confocal scanning. Shown is a 170-μm-wide strip of the column center. The cortical thickness was scaled to a standard column height (distance from pia to the border between cortex and white matter) of 1840 μm. Right panel: VPM bouton fluorescence intensity histogram along the vertical (pia to white matter) column axis (“bouton z-profile”) obtained from the image shown on the left panel. The profile was interpolated and smoothed for visualization. (B) Image showing thalamic boutons from the POm nucleus in a cortical column. The same cortical region as in (A) was selected for confocal scanning. Shown is a 220-μm-wide strip of the column center (the cortical thickness was scaled to 1840 μm). Right panel: POm bouton z-profile obtained from the image shown on the left panel. The profile was interpolated and smoothed for visualization. Bouton densities were calibrated by manual counting of boutons in confocal image stacks. VPM and POm peak bouton densities were found to be equal. Assuming a total of 2.9 × 10⁶ VPM boutons per column (see Materials and Methods), the underlying fluorescence intensities can be converted to bouton densities, yielding a peak density of 4.04 × 10⁷ boutons/mm3 for both POm and VPM and 1.8 × 10⁶ total POm boutons per column.
Figure 2.
Figure 2.
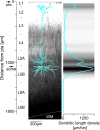
Dendritic length density profile of an L5 thick-tufted pyramidal neuron. Brightfield image of an acute thalamocortical slice of barrel cortex (left panel). Brightness/contrast was adjusted for better visualization of the barrel borders (lateral borders indicated by white lines; see Supplementary Fig. 1 for an image of the same slice after diaminobenzidine labeling for biocytin). WM: white matter. Soma location of the whole-cell recorded and biocytin-filled neuron indicated by white pipette tip. Blue: soma-dendritic reconstruction. For visualization, the reconstruction was scaled uniformly to a standard column height of 1840 μm. Right panel: Dendritic length density histogram along the vertical (pia to WM) column axis (“dendritic z-profile”) of the neuron shown on the left panel. The profile was interpolated and smoothed for visualization.
Figure 3.
Figure 3.
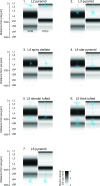
Examples of the overlap between single soma-dendritic neuron reconstructions of 7 types of excitatory cortical neurons and the VPM and POm bouton z-profiles. Representative single-cell reconstructions (blue) superimposed on the VPM bouton intensity profile (gray values, left panels) and the POm bouton intensity profile (right panels). Both VPM and POm bouton z-profiles were normalized to the peak fluorescence intensity (for conversion to bouton density, cf. Fig. 1 and Materials and Methods). Color bar applies to all panels.
Figure 4.
Figure 4.
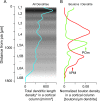
Total dendritic length distribution and normalized thalamocortical innervation density in a cortical column. (A) Dendritic z-profile of all excitatory neurons in a cortical column. All excitatory neurons were grouped based on soma depth from the pial surface. Average dendritic z-profiles were calculated for all groups. Each profile was then multiplied with the total number of excitatory neurons in a cortical column within the respective bin and the multiplied profiles were summated (i.e., the average dendritic z-profiles were convolved with a soma density profile). This yielded a profile representing the total excitatory neuron dendritic length at a given depth, which was finally normalized to the total cortical column volume to obtain an estimate of the dendritic path length per volume density (m/mm3). *Corrected for the expected fraction of excitatory neurons (85%, see Materials and Methods). (B) Normalized VPM (red line) and normalized POm (green line) bouton density profiles in units of boutons per micrometer dendrite obtained by dividing the bouton z-profiles (Fig. 1) by the total dendritic length profile as shown in (A). Profiles were interpolated and smoothed for visualization (see Materials and Methods).
Figure 5.
Figure 5.
Predicted number of thalamocortical boutons per neuron in dependence of soma location along the vertical column axis. (A) Soma depth dependence of total dendritic length per neuron quantified for all 82 excitatory neurons in the sample as the integral of the dendritic z-profiles. The dendritic length per neuron increased with soma depth in L2/L3 and L5 but not within groups of neurons of the same type. Colors: types of excitatory cortical neurons as defined by their somatodendritic morphologies (legend in (C)). For a depiction of all reconstructions, see Supplementary Figure 3. Blue arrow: neuron shown in the inset. Inset: example of the dendritic length density distribution of one neuron (same neuron as shown in Fig. 2); black arrow: soma position. (B) Soma depth dependence of total putative VPM innervation per neuron quantified as the integral of the single-neuron VPM innervation z-profile (inset, red line). Note that the total innervation of L3 and L5 thick-tufted pyramidal neurons increased significantly with soma depth, while L5 slender-tufted and L6 pyramid innervation decreased. Inset: Potential VPM (red line) and POm (green line) innervation z-profile of the L5 thick-tufted pyramidal neuron shown in Figure 2. Multiplication of the normalized bouton density profiles (Fig. 4B) with dendritic z-profiles of individual neurons (Fig. 2, inset in (A)) yields profiles representing the absolute number of putative thalamocortical contacts. The integrals of the innervation z-profiles are an estimate of the absolute number of boutons contacting a neuron. Vertical axis as inset in (A). (C) Soma depth dependence of total POm innervation per neuron. Quantification as in (B). Innervation of L5 slender-tufted pyramidal neurons increased significantly with soma depth, while L5 thick-tufted and L6 pyramidal neuron innervation decreased.
Figure 6.
Figure 6.
Average dendritic z-profiles and thalamocortical innervation density profiles of 7 excitatory neuron types. Left panels: Soma-aligned dendritic z-profiles (cf. Fig. 2) averaged for all neurons of a given type (see Supplementary Fig. 3 for all reconstructions). Average soma positions per type are indicated (dashed lines). Middle and right panels: Average VPM (middle panels) and POm (right panels) innervation density z-profiles representing the vertical distribution of potential thalamic contacts received by the 7 excitatory neuron types in a cortical column. Dashed lines indicate average soma positions. Note that because the profiles were aligned to the soma of the neurons, the average profiles can extend beyond the average pia (at z = 0).
Figure 7.
Figure 7.
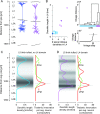
Subgroup of thick-tufted pyramidal neurons with an additional VPM innervation domain in L4. (A) Two examples of L5 thick-tufted pyramidal neurons with different dendritic arborization patterns (blue and purple). Note that the neuron on the left panel has a broad apical tuft and several distal apical oblique dendrites that terminate directly below L4. The neuron on the right panel has a narrower apical tuft and many distal apical oblique dendrites in L4. (B) Quantification of the dendritic arborization in L4 for the whole sample of L5 thick-tufted pyramidal neurons (n = 22). In contrast to the majority of the sample, which had no significant dendritic domain in L4 (blue circles, n = 18), 4 of the neurons (as defined by a cluster analysis, right panels) had 5 or more apical oblique dendrites of different primary bifurcation origin within 300 μm above the lower L4 border and more than 1000 μm total dendritic length within 500 and 800 μm depth from the pia (purple circles). Dark blue and dark purple circles: neurons shown in (A); for an illustration of all of the L5B neurons, see Supplementary Figure 3. Right panels: linkage dendrogram (top) and linkage distance (bottom) generated in a cluster analysis (Ward’s method, Euclidean distances, and Thorndike criterion for cluster cutoff, see Materials and Methods) that was the basis for the clustering shown in the plot on the left. (C, D) Comparison of the dendritic density profiles (left panels) and the resulting VPM and POm innervation profiles (right panels) for the 2 subtypes of thick-tufted L5 neurons as defined in (B). Dashed lines indicate average soma positions. Note the additional VPM innervation domain in L4 for the rare subtype with significant dendritic arborization in L4 (D, right panel; number of predicted VPM boutons in L4: 132 ± 72 [n = 4] vs. 29 ± 5.8 [n = 18], P < 0.03; see Materials and Methods).
Figure 8.
Figure 8.
Subcellular thalamocortical innervation domains for different excitatory neuron types in a cortical column. Thalamocortical innervation domains calculated by thresholding the contact z-profiles (cf. Fig. 6) at bouton densities of 5 per bin (effective bin size: 46 μm, cf. Materials and Methods; dark red and dark green for VPM and POm, respectively) and 10 per bin (light colors). Each neuron type showed a unique combination of subcellular thalamocortical innervation domains (see Discussion).

Comment in

References

    1. Agmon A, Connors BW. Thalamocortical responses of mouse somatosensory (barrel) cortex in vitro. Neuroscience. 1991;41:365–379. - PubMed
    1. Ahissar E, Sosnik R, Haidarliu S. Transformation from temporal to rate coding in a somatosensory thalamocortical pathway. Nature. 2000;406:302–306. - PubMed
    1. Andjelic S, Gallopin T, Cauli B, Hill EL, Roux L, Badr S, Hu E, Tamas G, Lambolez B. Glutamatergic nonpyramidal neurons from neocortical layer VI and their comparison with pyramidal and spiny stellate neurons. J Neurophysiol. 2009;101:641–654. - PMC - PubMed
    1. Armstrong-James M, Fox K, Das-Gupta A. Flow of excitation within rat barrel cortex on striking a single vibrissa. J Neurophysiol. 1992;68:1345–1358. - PubMed
    1. Bannister AP. Inter- and intra-laminar connections of pyramidal cells in the neocortex. Neurosci Res. 2005;53:95–103. - PubMed

Publication types

MeSH terms

Substances