. 2010 Oct;20(10):2277-86.
doi: 10.1093/cercor/bhq067. Epub 2010 Jun 9.

Number and laminar distribution of neurons in a thalamocortical projection column of rat vibrissal cortex

Affiliations

Number and laminar distribution of neurons in a thalamocortical projection column of rat vibrissal cortex

Hanno S Meyer et al. Cereb Cortex. 2010 Oct.

Abstract

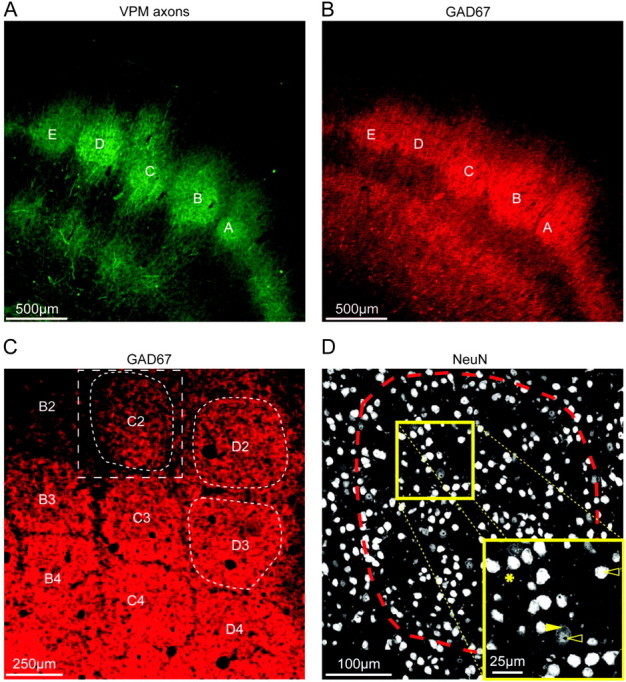
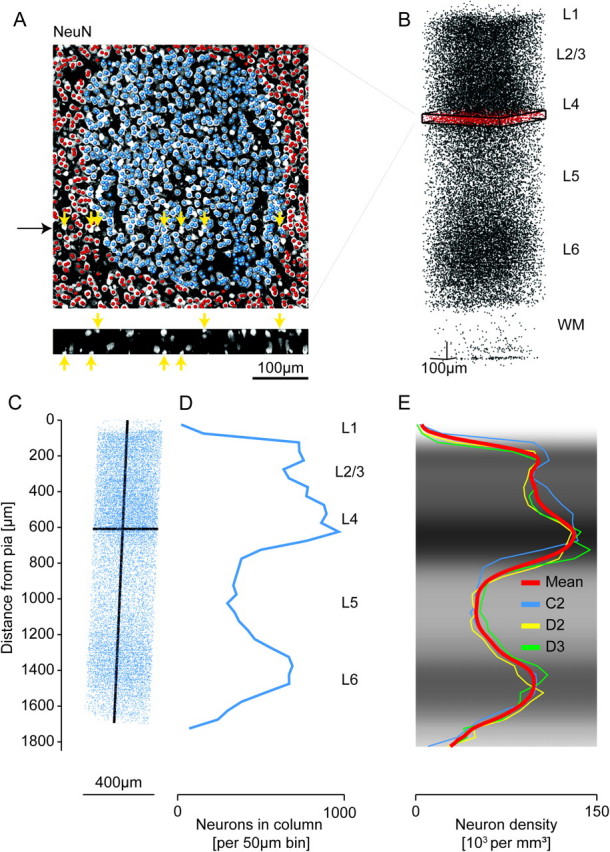
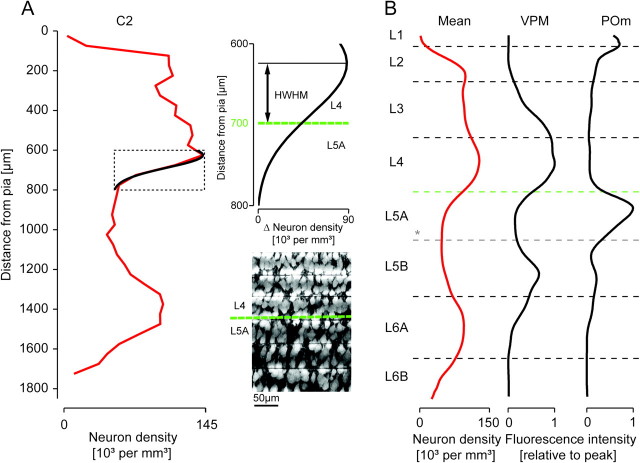
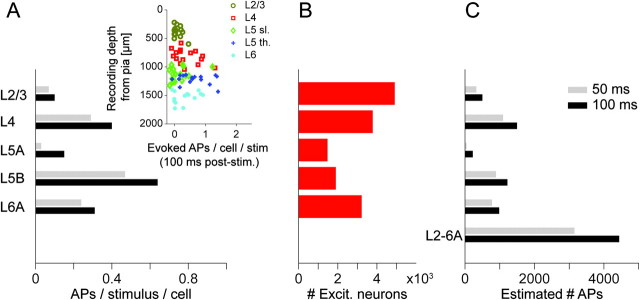
This is the second article in a series of three studies that investigate the anatomical determinants of thalamocortical (TC) input to excitatory neurons in a cortical column of rat primary somatosensory cortex (S1). Here, we report the number and distribution of NeuN-positive neurons within the C2, D2, and D3 TC projection columns in P27 rat somatosensory barrel cortex based on an exhaustive identification of 89,834 somata in a 1.15 mm(3) volume of cortex. A single column contained 19,109 ± 444 neurons (17,560 ± 399 when normalized to a standard-size projection column). Neuron density differences along the vertical column axis delineated "cytoarchitectonic" layers. The resulting neuron numbers per layer in the average column were 63 ± 10 (L1), 2039 ± 524 (L2), 3735 ± 905 (L3), 4447 ± 439 (L4), 1737 ± 251 (L5A), 2235 ± 99 (L5B), 3786 ± 168 (L6A), and 1066 ± 170 (L6B). These data were then used to derive the layer-specific action potential (AP) output of a projection column. The estimates confirmed previous reports suggesting that the ensembles of spiny L4 and thick-tufted pyramidal neurons emit the major fraction of APs of a column. The number of APs evoked in a column by a sensory stimulus (principal whisker deflection) was estimated as 4441 within 100 ms post-stimulus.


Figures

Figure 1.
Figure 1.
Outlines of TC projection columns. (A) Fluorescence image of a semi-coronal slice of barrel cortex showing thalamic VPM axons visualized by viral-mediated fluorescence (mOrange). Barrels A–E in layer 4 can be delineated as spots of high VPM axon density. (B) GAD67 immunofluorescence image of the slice shown in (A). The GAD67 immunofluorescence showed hot spots in layer 4 whose outlines match the patches of TC projection. (C) GAD67 fluorescence image of a tangential slice of L4 of barrel cortex. Arcs 2–4 of rows B–D are shown. Barrels can be delineated as hot spots of GAD67 immunofluorescence. The white box (dashed rectangle) illustrates the region of interest that was selected for imaging the C2 barrel column (dashed barrel outline) through the entire depth of the cortex using confocal scanning microscopy. The D2 and D3 barrel columns were also imaged. (D) NeuN immunofluorescence image (single optical slice) from a confocal scan of a tangential slice (thickness: 50 μm) of the region of interest outlined in (C). Dashed line: barrel outline of the C2 barrel. The inset illustrates that NeuN immunolabeling predominantly stains the nucleus. However, it also outlines the cytosol (arrows); sometimes, even parts of dendrites can be followed (asterisk), as reported before (Mullen et al. 1992).
Figure 2.
Figure 2.
Number and distribution of NeuN-positive cell bodies. (A) Overlay of a maximum intensity NeuN immunofluorescence image with markers that were manually placed at the presumptive midpoints of NeuN-positive cell bodies (blue markers were located within the C2 barrel outline). Yellow arrows indicate examples of somata that were located at the edge of a slice and were contained to less than half in that slice (see reslice in the bottom panel; black arrow indicates reslice location); these neurons were counted in the adjacent slice; for estimates of the measurement error introduced by this counting procedure, see Materials and Methods and Discussion. (B) 29 159 markers identified as NeuN-positive somata in the region of interest comprising the C2 barrel column. Red: slice shown in (A). (C) 18 597 manually placed markers indicating NeuN-positive cell bodies within the C2 barrel column, which was defined by extrapolation of the barrel outline in L4 (see Fig. 1) along the vertical column axis (which was assumed to be perpendicular to the pial surface). (D) 1D profile of marker density projected onto the vertical column axis. (E) 1D profiles of NeuN density along the respective vertical column axis for the C2, D2, and D3 columns and the mean profile. Gray scale indicates mean NeuN density. Profiles were scaled to the length of a “standard” TC projection column (1840 μm, see Wimmer et al. 2010 and Results). The indicated layers represent approximate layer boundaries; for a quantitative definition of layer borders, see Figure 3, Table 2, and Results.
Figure 3.
Figure 3.
Definition of layer borders based on the density of NeuN-positive cell bodies along the vertical column axis. (A) Cytoarchitectonic layer borders (dashed black horizontal lines) determined based on the vertical neuron density gradients (red line, left panel) by fitting Gaussian functions to the neuron density z-profile of the C2 column at the presumed layer borders. Inset: Example of fit used to define the L4-to-L5A border. HWHM, half width half maximum. Maximum intensity projection images of 6 consecutive slices of the C2 column illustrating that the fitted L4-to-L5A layer border (green dashed line) matched the apparent density drop in the anti-NeuN immunofluorescence. For a summary of the resulting layer heights, see Table 2. (B) Comparison of the such defined layer borders with profiles of thalamic projection density (profiles from Meyer et al. 2010). *The border between L5A and L5B could not be defined based on changes in neuron density. We therefore used GAD67 immunofluorescence to delineate the border between L5A and L5B, which provided clear subdivision of layer 5 (cf. Fig. 1B) and matched the putative L5A outline defined by the POm projection density.
Figure 4.
Figure 4.
Estimation of the number of action potentials emitted from a cortical column in response to a sensory stimulus. (A) Average number of APs per neuron type elicited by stimulation of the principal whisker within a 50 ms and 100 ms post-stimulus time window, respectively. Inset: Number of evoked APs per neuron in dependence of soma depth from the pia for the 100 ms time window (different colors illustrate different neuron types as determined by their dendritic morphology). Data from de Kock et al. (2007). (B) Number of excitatory neurons in a cortical column per type (Fig. 3A and Table 1). (C) Estimated number of APs evoked in a cortical column in response to stimulation of the principal whisker. Note that the majority of APs are emitted by spiny L4 neurons (35% within 50 ms, 34% within 100 ms time window) and thick-tufted L5 pyramidal neurons (28% in both time windows). For the number of spontaneous and the total number of APs within these time windows, see Table 3.

Comment in

References

    1. Beaulieu C. Numerical data on neocortical neurons in adult rat, with special reference to the GABA population. Brain Res. 1993;609:284–292. - PubMed
    1. Beaulieu C, Kisvarday Z, Somogyi P, Cynader M, Cowey A. Quantitative distribution of GABA-immunopositive and -immunonegative neurons and synapses in the monkey striate cortex (area 17) Cereb Cortex. 1992;2:295–309. - PubMed
    1. de Kock CP, Bruno RM, Spors H, Sakmann B. Layer- and cell-type-specific suprathreshold stimulus representation in rat primary somatosensory cortex. J Physiol. 2007;581:139–154. - PMC - PubMed
    1. Douglas RJ, Martin KA. Mapping the matrix: the ways of neocortex. Neuron. 2007;56:226–238. - PubMed
    1. Feldmeyer D, Egger V, Lubke J, Sakmann B. Reliable synaptic connections between pairs of excitatory layer 4 neurones within a single ‘barrel’ of developing rat somatosensory cortex. J Physiol. 1999;521(Pt 1):169–190. - PMC - PubMed

Publication types

MeSH terms