. 2010 Jun 9;30(23):7793-803.
doi: 10.1523/JNEUROSCI.0577-10.2010.

Delayed stabilization of dendritic spines in fragile X mice

Affiliations

Delayed stabilization of dendritic spines in fragile X mice

Alberto Cruz-Martín et al. J Neurosci. .

Abstract

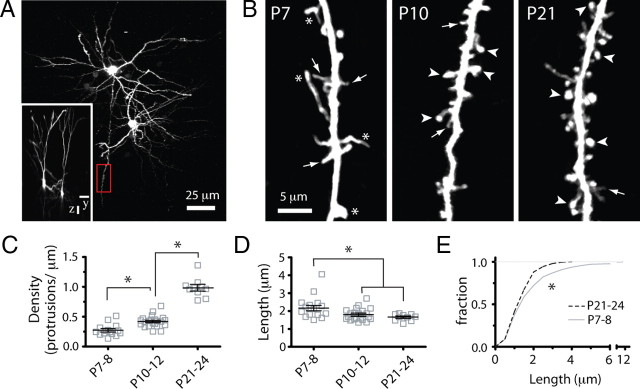
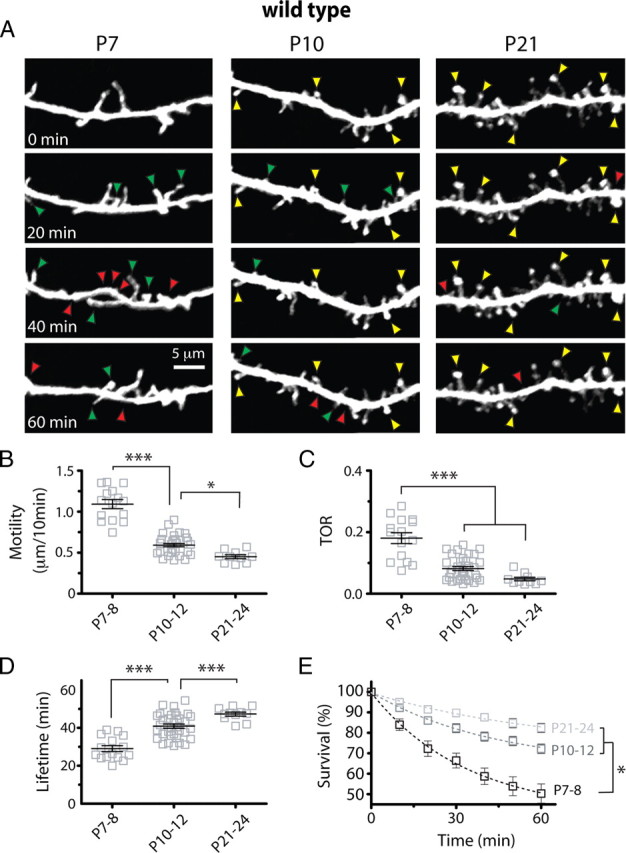
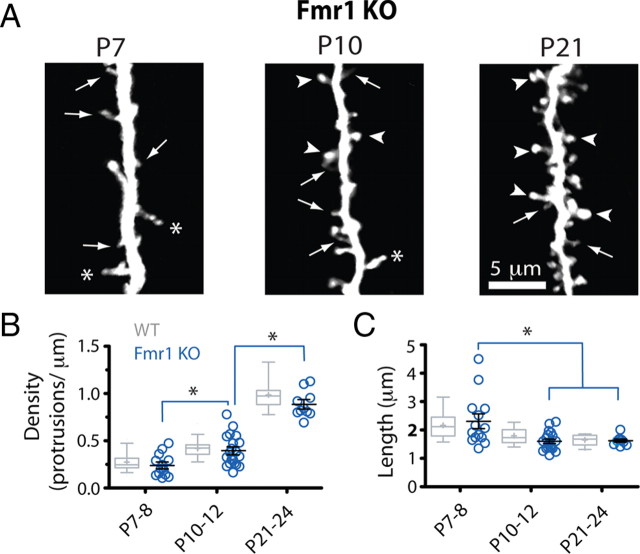
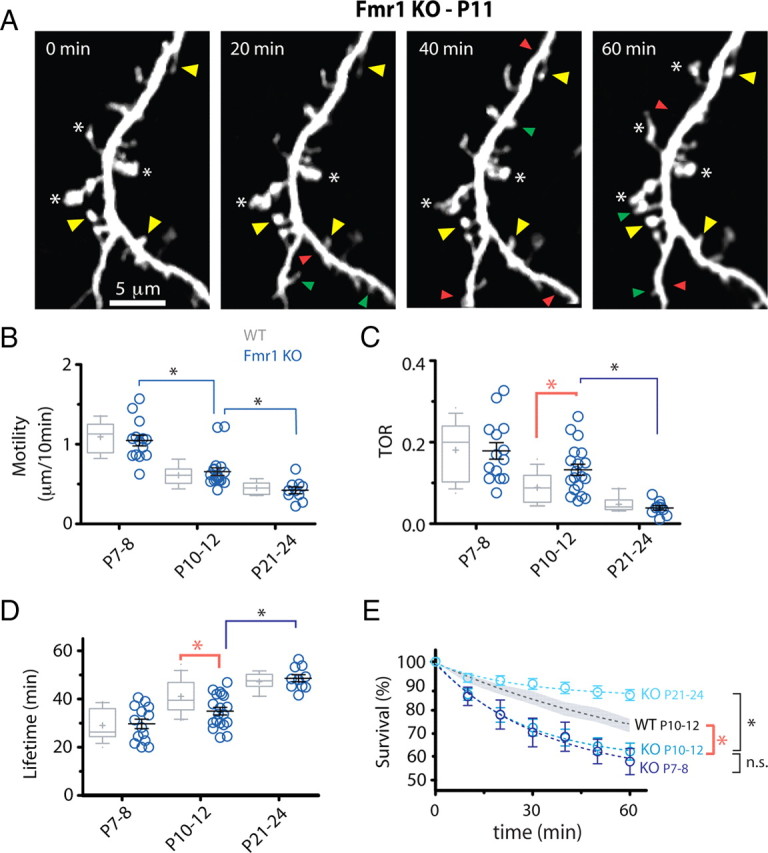
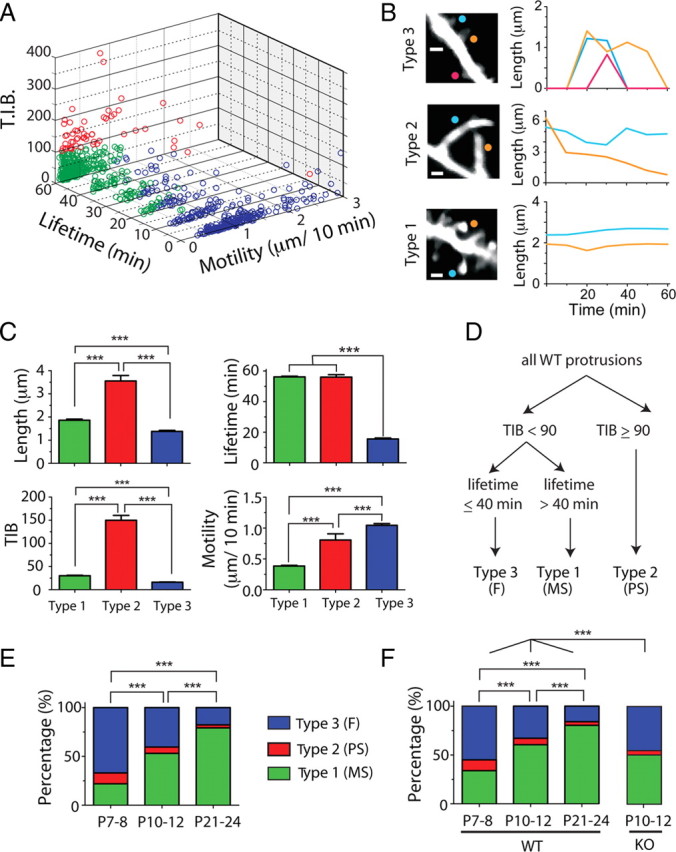
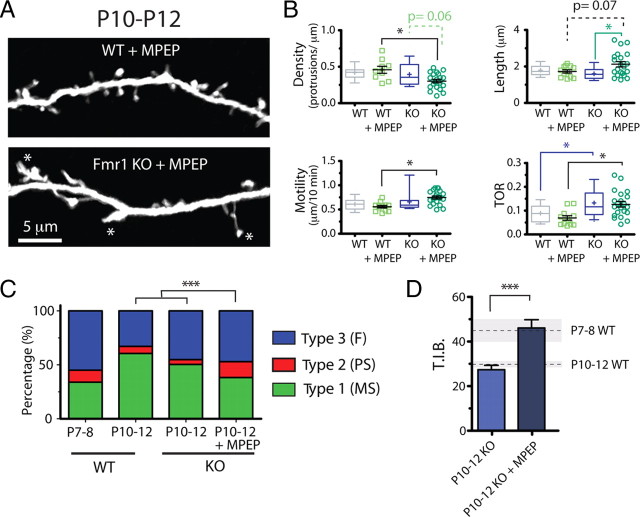
Fragile X syndrome (FXS) causes mental impairment and autism through transcriptional silencing of the Fmr1 gene, resulting in the loss of the RNA-binding protein fragile X mental retardation protein (FMRP). Cortical pyramidal neurons in affected individuals and Fmr1 knock-out (KO) mice have an increased density of dendritic spines. The mutant mice also show defects in synaptic and experience-dependent circuit plasticity, which are known to be mediated in part by dendritic spine dynamics. We used in vivo time-lapse imaging with two-photon microscopy through cranial windows in male and female neonatal mice to test the hypothesis that dynamics of dendritic protrusions are altered in KO mice during early postnatal development. We find that layer 2/3 neurons from wild-type mice exhibit a rapid decrease in dendritic spine dynamics during the first 2 postnatal weeks, as immature filopodia are replaced by mushroom spines. In contrast, KO mice show a developmental delay in the downregulation of spine turnover and in the transition from immature to mature spine subtypes. Blockade of metabotropic glutamate receptor (mGluR) signaling, which reverses some adult phenotypes of KO mice, accentuated this immature protrusion phenotype in KO mice. Thus, absence of FMRP delays spine stabilization and dysregulated mGluR signaling in FXS may partially normalize this early synaptic defect.


Figures

Figure 1.
Figure 1.
Developmental regulation of early dendritic protrusion density and length in wild-type mice. A, Low-magnification view of two L2/3 pyramidal cells in the somatosensory cortex of a P10 WT mouse that was sparsely labeled with GFP via in utero electroporation and imaged with two-photon microscopy in vivo. The image is a maximum intensity projection of ∼150 slices (3 μm apart). The inset shows the side view (yz projection) of the same cells. Scale bars, 25 μm. The boxed region in red (shown at higher magnification in B, middle panel) is an example of a dendritic region of interest from the apical tuft that was chosen for time-lapse imaging. B, High-magnification view of representative dendritic branches at the three postnatal ages examined. Images are best projections (∼5–7 optical sections, 1 μm apart). Throughout development, thin protrusions (arrows) are gradually replaced with larger spines (arrowheads), typical of mature dendrites. Note also the presence of long and very bright protrusions (asterisks) at P7–P8. C, Density of dendritic protrusions at different postnatal ages. Each square indicates a different dendrite. The largest increase in protrusion density occurs after P10–P12. *p < 0.05, one-way ANOVA followed by Tukey's multiple-comparison test in C and D. D, Length of dendritic protrusions changes only slightly during postnatal development and remains constant after P10–P12. E, Frequency distribution histogram of average protrusion length at P7–P8 and P21–P24 (*p < 0.05, Kolmogorov–Smirnov test). Very long protrusions (>4 μm) represent 8% of all protrusions at P7–P8 but are absent at P21–P24. The distribution of protrusion lengths at P10–P12 (data not shown) was also significantly different from that of P7–P8 and P21–P24 mice.
Figure 2.
Figure 2.
Downregulation of early protrusion dynamics between P7–P8 and P10–P12. A, High-resolution in vivo time-lapse two-photon imaging of dendritic protrusions. Images are best projections (∼6–14 optical sections, 1 μm apart) collected every 10 min (only one-half of the time points are shown for simplicity). Examples of gained (green arrowheads), lost (red arrowheads), and stable (yellow arrowheads) protrusions are indicated. B–D, Motility, TOR, and lifetime of dendritic protrusions at different postnatal ages (***p < 0.001, one-way ANOVA with Tukey's test). Protrusions stabilize quickly between P7–P8 and P10–P12. E, Survival graphs for dendritic protrusions over a 60 min time-lapse imaging session at different postnatal ages (t 1/2 = 53.6, 125.2, and 204.2 min at P7–P8, P10–P12, and P21–P24, respectively; *p < 0.05, two-way ANOVA with Bonferroni's posttest).
Figure 3.
Figure 3.
Length and density of protrusions develop normally in Fmr1 KO mice. A, High-resolution images of dendritic protrusions at different postnatal ages (best projections; ∼8–12 optical sections, 1 μm apart). Compared with WT mice (gray bars), dendrites in mutant mice (blue circles) appeared to have an abundance of thin protrusions (arrows) and fewer mushroom spines with heads (arrowheads) (for detailed quantification of this phenotype, see also Fig. 5). The asterisks point to large knobby protrusions that are usually seen in WT mice at P7–P8. B, C, Density and length of dendritic protrusions at different postnatal ages. Each blue circle indicates a different dendrite from a KO mouse. Control values from WT mice are indicated by gray box-and-whisker plots that show the average (+) and the median (horizontal line). The whiskers represent the 10 and 90 percentile boundaries. *p < 0.05, one-way ANOVA followed by Tukey's test. There were no significant differences between WT and Fmr1 KO mice.
Figure 4.
Figure 4.
Protrusions in Fmr1 KO mice are abnormally unstable. A, Representative in vivo time-lapse imaging of dendritic protrusions in Fmr1 KO mice at P11. Imaged are best projections (9–11 slices, 1 μm apart). Note the high prevalence of immature knobby protrusions (asterisks) and high turnover. Images were collected every 10 min but only one-half of the time points are shown for simplicity. Added, lost, and stable spines are labeled with green, red, and yellow arrowheads, respectively. B, Motility of dendritic protrusions develops normally in KO mice (blue circles). *p < 0.05, one-way ANOVA followed by Tukey's test for B–D. C, D, TOR and lifetime of dendritic protrusions at different postnatal ages. The developmental change in protrusion turnover and lifetime was delayed in mutant mice compared with WT mice. This transient defect in turnover resulted in an abnormal decrease in protrusion lifetime only in P10–P12 KO mice. E, Survival graphs for dendritic protrusions over a 60 min imaging session at different postnatal ages. The graph for WT protrusions at P10–P12 (average, dashed black line; SEM, gray shadow) is also shown for comparison. Note the developmental delay in protrusion turnover maturation in KO mice, as shown by nearly identical survival curves at P7–P8 and P10–P12 (t 1/2 = 67.9 and 72.6 min, respectively; *p < 0.05, two-way ANOVA with Bonferroni's posttest).
Figure 5.
Figure 5.
Overabundance of immature protrusion subtypes in Fmr1 KO mice. A, Cluster analysis of all WT protrusions from P7 to P24, based on lifetime, motility, and TIB (total integrated brightness of GFP). Protrusions were segregated into three groups using a k-means test in MATLAB clustering algorithm (see Materials and Methods). B, Representative examples of the three types of protrusions and their length over time in time-lapse imaging sessions. Note that type 2 protrusions are longer and brighter than the others. C, Average length, TIB, lifetime, and motility for each of the three types of protrusions. Types 1, 2, and 3 institutively fall into three well established types of protrusion: mature spines (MS), protospines (PS), and filopodia (F). ***p < 0.001, one-way ANOVA with Tukey's test in C, E, and F. D, Manual sorting of protrusions based on parameters inspired from cluster analysis. These cutoffs were then applied to the protrusions from KO mice. E, Relative abundance of individual protrusion subclasses at different postnatal ages in WT mice as determined by k-means test (includes all protrusions). F, Relative abundance of individual protrusion subclasses in WT and Fmr1 KO mice using cutoffs inspired by k-means test (A) for TIB and lifetime.
Figure 6.
Figure 6.
Dysregulated mGluR signaling in neonatal Fmr1 KO mice—mGluR antagonist uncovers other immature dendritic protrusion phenotypes but fails to rescue abnormal TOR. A, Representative images showing WT and KO dendrites (top and bottom, respectively) that were treated chronically with MPEP (30 mg/kg, i.p.). B, Density, length, motility, and turnover (TOR) of protrusions after treatment with MPEP. The mGluR antagonist caused a specific decrease in the density, increase in the average length, and a higher motility of protrusions in KO mice. However, MPEP failed to rescue the abnormal TOR phenotype in KO animals and did not affect baseline TOR levels in WT mice. *p < 0.05, one-way ANOVA with Tukey's test in B and C. C, Relative abundance of individual protrusion subclasses in Fmr1 KO mice with and without MPEP treatment using cutoffs inspired by k-means test for TIB and lifetime (Fig. 5 D). The distribution of different subtypes of protrusions in KO mice treated with MPEP resembled most that of WT protrusions at P7–P8. ***p < 0.001. D, TIB for Fmr1 KO mice at P10–P12 with and without MPEP treatment. The average (dashed line) and SEM (shaded area) values for WT mice at P7–P8 and P10–P12 are shown for comparison. ***p < 0.001, Student's t test.

References

    1. Abe K, Chisaka O, Van Roy F, Takeichi M. Stability of dendritic spines and synaptic contacts is controlled by alpha N-catenin. Nat Neurosci. 2004;7:357–363. - PubMed
    1. Abu-Elneel K, Ochiishi T, Medina M, Remedi M, Gastaldi L, Caceres A, Kosik KS. A delta-catenin signaling pathway leading to dendritic protrusions. J Biol Chem. 2008;283:32781–32791. - PubMed
    1. Antar LN, Li C, Zhang H, Carroll RC, Bassell GJ. Local functions for FMRP in axon growth cone motility and activity-dependent regulation of filopodia and spine synapses. Mol Cell Neurosci. 2006;32:37–48. - PubMed
    1. Bagni C, Greenough WT. From mRNP traficking to spine dysmorphogenesis: the roots of fragile X syndrome. Nat Rev Neurosci. 2005;6:376–387. - PubMed
    1. Bassell GJ, Warren ST. Fragile X syndrome: loss of local mRNA regulation alters synaptic development and function. Neuron. 2008;60:201–214. - PMC - PubMed

Publication types

MeSH terms

Substances