. 2010 Jun 9;30(23):7863-77.
doi: 10.1523/JNEUROSCI.4574-09.2010.

Rab11 supports amphetamine-stimulated norepinephrine transporter trafficking

Affiliations

Rab11 supports amphetamine-stimulated norepinephrine transporter trafficking

Heinrich J G Matthies et al. J Neurosci. .

Abstract

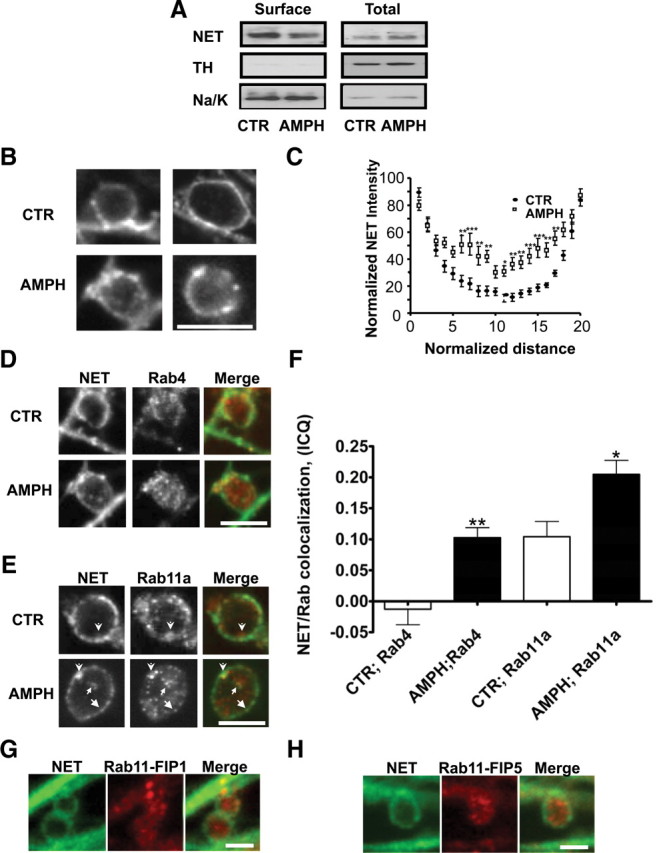
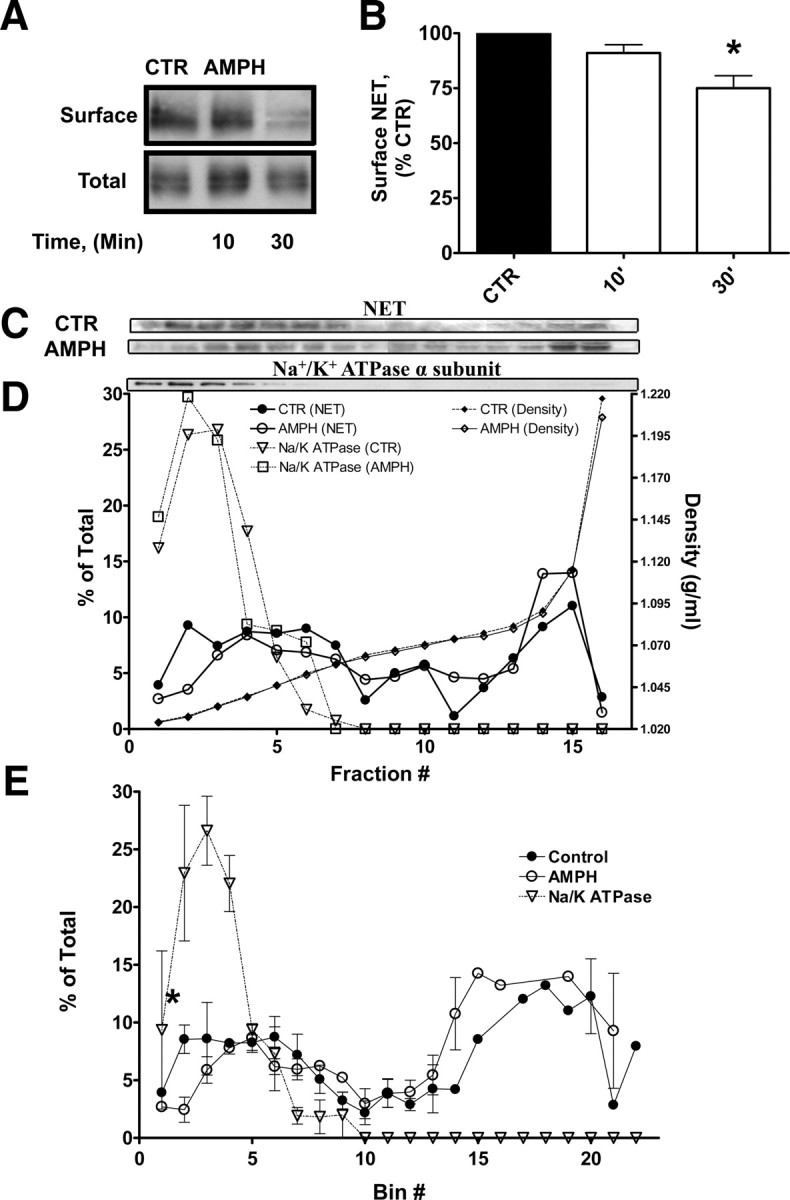
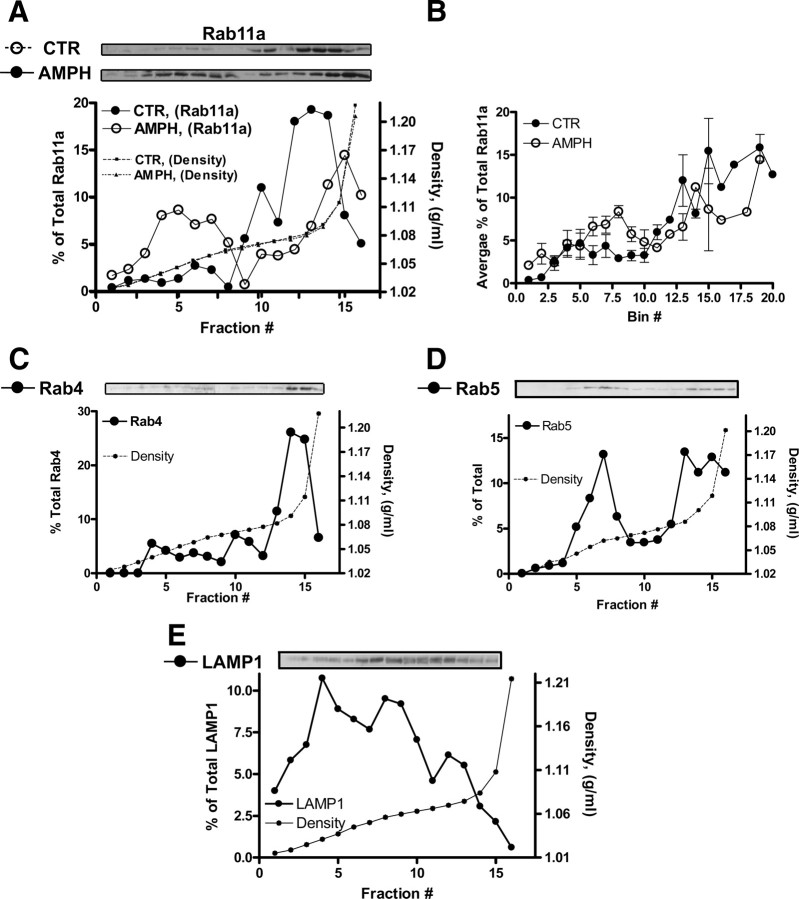
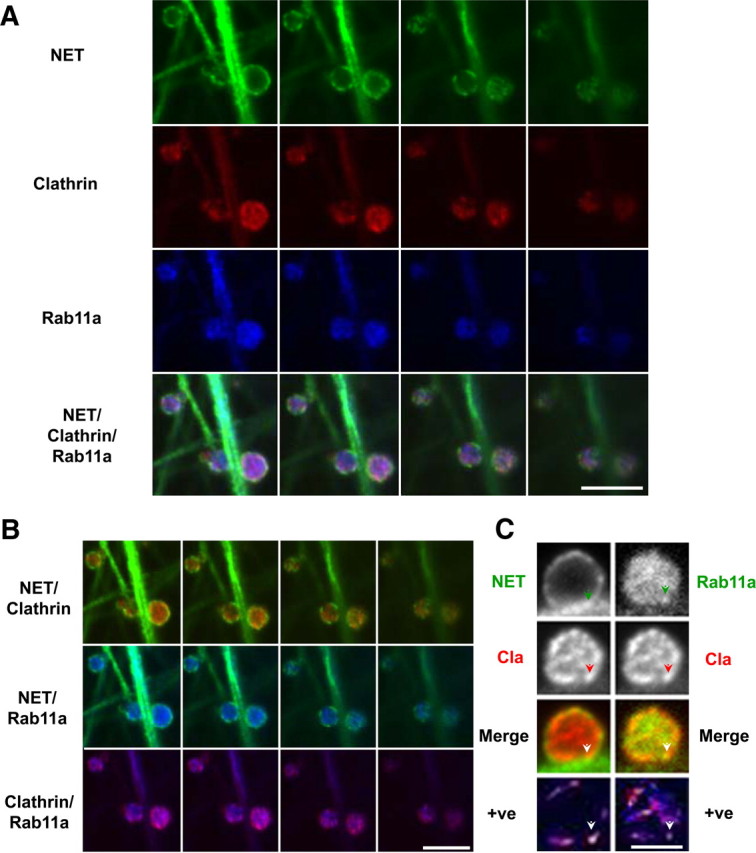
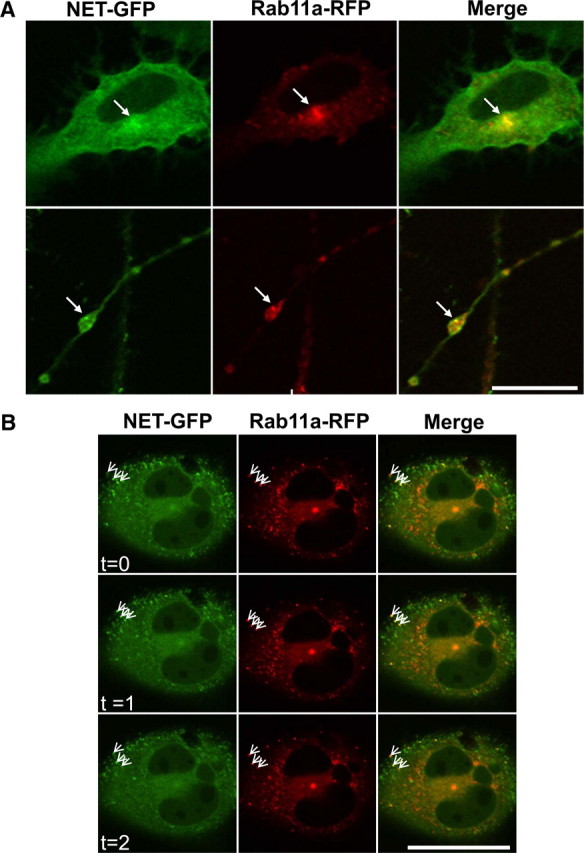
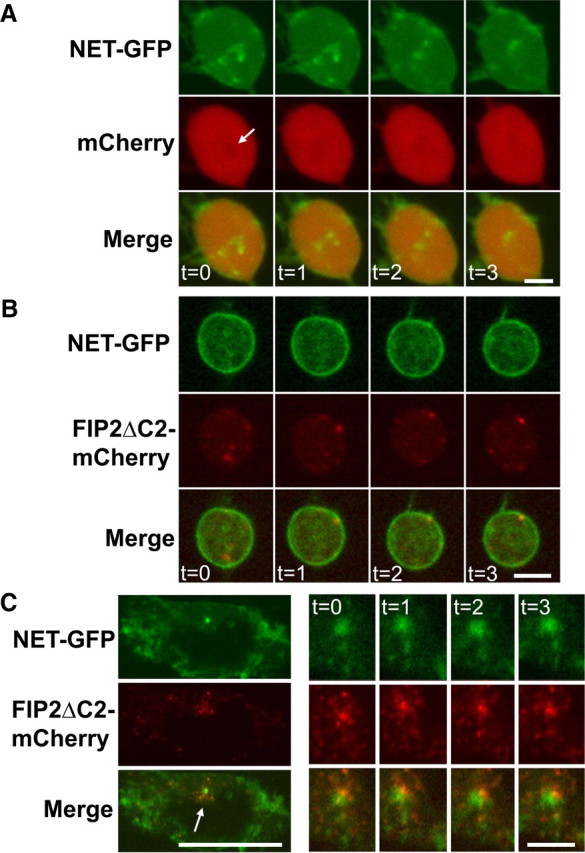
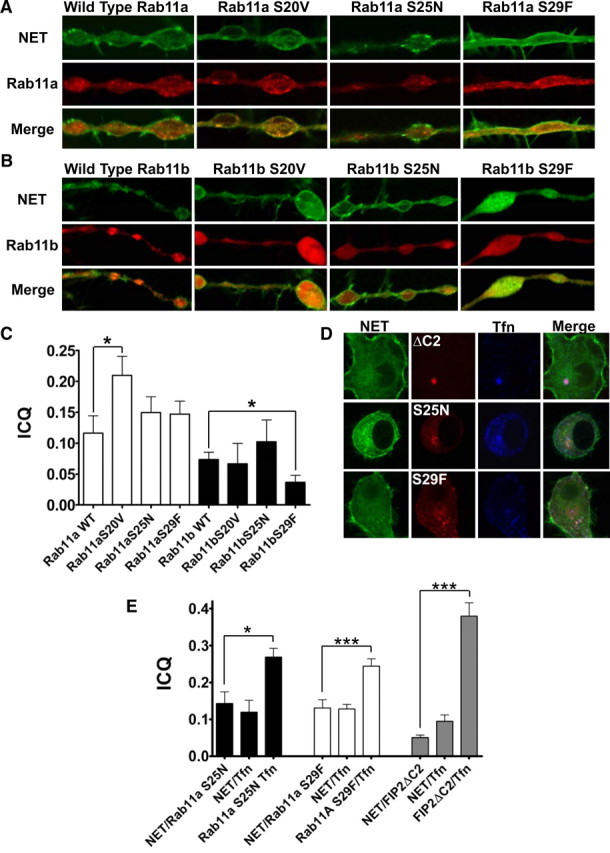
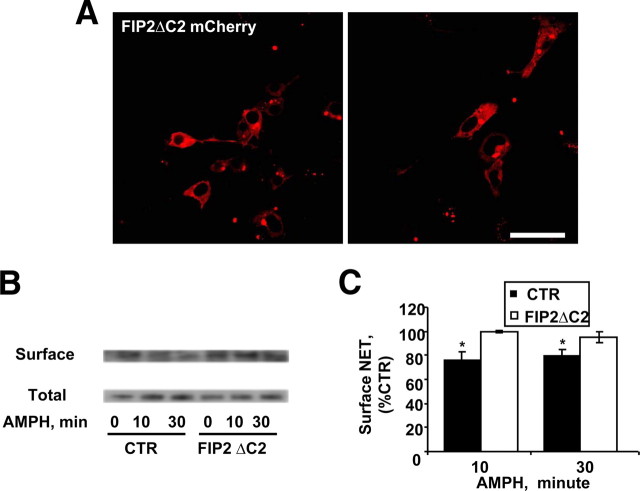
The norepinephrine transporter (NET) is a presynaptic plasma membrane protein that mediates reuptake of synaptically released norepinephrine. NET is also a major target for medications used for the treatment of depression, attention deficit/hyperactivity disorder, narcolepsy, and obesity. NET is regulated by numerous mechanisms, including catalytic activation and membrane trafficking. Amphetamine (AMPH), a psychostimulant and NET substrate, has also been shown to induce NET trafficking. However, neither the molecular basis nor the nature of the relevant membrane compartments of AMPH-modulated NET trafficking has been defined. Indeed, direct visualization of drug-modulated NET trafficking in neurons has yet to be demonstrated. In this study, we used a recently developed NET antibody and the presence of large presynaptic boutons in sympathetic neurons to examine basal and AMPH-modulated NET trafficking. Specifically, we establish a role for Rab11 in AMPH-induced NET trafficking. First, we found that, in cortical slices, AMPH induces a reduction in surface NET. Next, we observed AMPH-induced accumulation and colocalization of NET with Rab11a and Rab4 in presynaptic boutons of cultured neurons. Using tagged proteins, we demonstrated that NET and a truncated Rab11 effector (FIP2DeltaC2) do not redistribute in synchrony, whereas NET and wild-type Rab11a do. Analysis of various Rab11a/b mutants further demonstrates that Rab11 regulates NET trafficking. Expression of the truncated Rab11a effector (FIP2DeltaC2) attenuates endogenous Rab11 function and prevented AMPH-induced NET internalization as does GDP-locked Rab4 S22N. Our data demonstrate that AMPH leads to an increase of NET in endosomes of single boutons and varicosities in a Rab11-dependent manner.


Figures

Figure 1.
Figure 1.
Amphetamine leads to a decrease in surface NET expression in rat cortical slices and NET in boutons and colocalization of NET with Rab11a and Rab4. A, Representative immunoblots of surface and total NET from biotinylated rat cortical slices. 300 μm rat cortical slices [paired right vs left hemispheres for vehicle (CTR) vs AMPH] were incubated for 30 min with 10 μm AMPH and then biotinylated (see Materials and Methods). A volume of 25 μl of total slice lysate was loaded per sample (lane). A volume of 45 μl of eluted (biotinylated proteins) was loaded per sample (lane). Tyrosine hydroxylase and Na/K ATPase immunoreactivity was also probed. A total of 13 cortical slices from three rats were analyzed. *p < 0.05 by Student's t test. Mouse SCGNs were cultured and processed for immunocytochemistry as described in Materials and Methods. B, SCGNs treated with 10 μm AMPH for 30 min leads to an accumulation of intracellular NET in SCGN boutons. Images are taken from single confocal and depict single boutons with associated axons (linear structures). The perimeter of the boutons is marked by intense NET immunoreactivity, as well as intrabouton immunoreactivity, which is increased by AMPH. C, Analysis of intensity plots spanning SCGN boutons demonstrates that AMPH treatment induces NET accumulation in the interior of these boutons. The normalized NET intensity is plotted against the normalized distance as described in Materials and Methods. D, AMPH treatment of SCGNs enhances NET and Rab4 colocalization in boutons. Shown in the top row are boutons from cultures treated with vehicle (basal state). Shown in the bottom row are AMPH-stimulated cells showing colocalization between NET and Rab4. E, AMPH treatment of SCGNs enhances NET and Rab11a colocalization in boutons. Shown in the top row are boutons from cultures treated with vehicle (basal state), and arrowheads indicate colocalization of NET and Rab11a at a juxtaplasma membrane location. The intensity of the juxtaplasma membrane NET is lower than on the perimeter. Shown in the bottom row are AMPH-stimulated cells with arrows pointing to surface (arrows), juxtaplasma membrane (arrowhead), and internal (small arrow) regions showing colocalization between NET and Rab11a. F, Quantitation of NET and Rab11a, Rab4 colocalization using the ICQ as outlined in Materials and Methods (Li et al., 2004) demonstrates that AMPH enhances the colocalization of NET and Rab11a as well as Rab4. G, H, Rab11a effectors are present in the presynaptic compartments of SCGN. Scale bar, 5 μm. Error bars indicate SEM.
Figure 2.
Figure 2.
AMPH-induced loss of NET from the cell surface and redistribution to intracellular organelles characterized by cell fractionation. A, AMPH treatment (10 μm) of NET cells leads to a reduction of the intensity of NET in the biotinylated fraction. Shown is a representative Western blot. B, Quantitation of an AMPH-induced decrease of NET in the biotinylated fraction. Biotinylated band intensities are normalized to total NET and expressed as percentage of control (Student's t test, *p ≤ 0.05; n = 7). C, AMPH treatment of NET cells for 30 min leads to a redistribution of NET away from a light plasma membrane fraction. Top, Shown are immunoblots of NET from either vehicle- or AMPH (10 μm)-treated NET cells from various fractions of an OptiPrep gradient (low-density fractions on the left; denser fractions on right). Below is an immunoblot of Na/K ATPase, a plasma membrane protein, which we used to identify plasma membrane fractions. D, A plot of the percentage in each fraction of total NET intensity obtained from NET cells treated with AMPH (open circles) or vehicle (filled circles). The percentage of the total intensity of the Na/K ATPase (open triangles) in various fractions is also shown. The right y-axis indicates the density of the fractions of the OptiPrep gradient from lysates treated with AMPH (open diamonds) or vehicle (filled diamonds). E, Graph averaging the results of NET immunoblots obtained as in D from three independent OptiPrep gradients. Error bars indicate SEM.
Figure 3.
Figure 3.
Rab11a-containing fractions have similar densities to NET-containing fractions in both control and AMPH-treated cells. A, Top, Displayed are immunoblots of fractions from OptiPrep gradients used to fractionate extracts from control vehicle-treated (CTR) or AMPH-treated NET cells. Less dense fractions are on the left, whereas denser fractions are on the right side of the immunoblot. Bottom, Quantitation of the immunoblots. Plotted is the percentage of the total Rab11a loaded into the gradient versus the fraction number. AMPH leads to accumulation of Rab11a in lighter fractions. B, Shown is a plot representing the quantitation of three independent experiments. In this plot, the percentage of the total Rab11a loaded into the gradient is on the y-axis, and the x-axis represents bins generated based on the density of each fraction (see Materials and Methods). C–E, Marker for early (Rab4, Rab5) and late (LAMP1) endosomal fractions are shown. Error bars indicate SEM.
Figure 4.
Figure 4.
At early time points of AMPH treatment of SCGNs, Rab11a colocalizes with clathrin at juxtaplasma membrane and internal sites. Mouse SCGNs were cultured, treated with vehicle or AMPH (10 μm) for 10 min, and processed for immunocytochemistry as described in Materials and Methods. All images are taken from single confocal sections. Cultures were treated with vehicle or AMPH (10 μm) for 10 min. At this time point, low levels of NET are internalized (Fig. 2). A, In this panel, single confocal sections spanning the boutons from the center to the bottom are displayed. They are tripled labeled for NET, clathrin, and Rab11a. The merge of the triple-labeled sections is shown in the fourth row. Scale bar, 2.5 μm. B, Displayed are the double-merge images of the same sections as in A. Some colocalization of clathrin with NET is detected at the edges of NET puncta (top row), and low levels of NET and Rab11a can be seen at the perimeter (middle row). Finally, clathrin and Rab11a are highly colocalized both at the surface and in the interior (bottom row). Scale bar, 2.5 μm. C, In this panel, single confocal sections at the center to the bottom are displayed. This section was tripled labeled for NET (NET), clathrin (Cla), and Rab11a (Rab11a). For the sake of comparison, the double-merged image was generated by pseudocoloring both NET and Rab11a red, whereas clathrin was green. In the bottom row are images that display pseudocolored pixels from the images of boutons in which the pixel values for the two relevant antigens are both above the mean. An arrowhead indicate a site in which both NET/clathrin colocalize and Rab11a/clathrin colocalize based on analyzing the two images in the bottom panel (see Materials and Methods). Scale bar, 2.5 μm.
Figure 5.
Figure 5.
NET and Rab11a colocalize in living CAD cells. A, GFP-NET and RFP-Rab11a were coexpressed in CAD cells. In the top row are single confocal sections of the cell bodies showing GFP-NET and RFP-Rab11a; the arrows indicate colocalization. In axonal swellings, these two fusion proteins also colocalize (second row; see arrows). Scale bar, 25 μm. B, Shown are single confocal sections of cell bodies from cells expressing GFP-NET and RFP-Rab11a at three different time points, collected approximately every 35 s. The three arrows indicate examples of motile organelles in close proximity coexpressing both GFP-NET and RFP-Rab11a, in which GFP and RFP fluorescence have synchronous motility. Scale bar, 50 μm.
Figure 6.
Figure 6.
GFP-NET and FIP2ΔC2 do not colocalize in living CAD cells. CAD cells were transfected with both GFP-NET and either mCherry or mCherry-FIP2 C2Δ. A, Shown are single confocal sections GFP-NET in axonal swellings from control cells with mCherry at four time points separated by 30 s. We observed discrete regions of dense motile GFP-NET not interacting with mCherry. B, GFP-NET and mCherry-FIP2ΔC2 in axonal swellings do not colocalize, do not have similar morphologies, nor move in synchrony. Displayed are single confocal sections taken at four time points at 30 s intervals. Note that, occasionally, mCherry-FIP2ΔC2 tracks inner surface of GFP-NET demarcated perimeter. C, Neither colocalization nor synchronous movements were detected in cell bodies expressing GFP-NET and mCherry-FIP2ΔC2. The majority of areas with the most intense fusion protein localization were detected in non-overlapping regions of the cell body (low-magnification confocal section of one entire cell body). However, a fraction of GFP-NET did concentrate in perinuclear regions in which a much larger fraction of mCherry-FIP2ΔC2 is detected (see arrow in merged image on the left). However, observation of these regions in time series revealed that GFP-NET and mCherry-FIP2ΔC2 do not move with similar motile properties. See images of four time points generated every 30 s on the right side. Scale bars, 5 μm.
Figure 7.
Figure 7.
Mutants of Rab11a/b modify GFP-NET intracellular distribution. A, NET colocalizes with various Rab11a/b mutants in boutons of CAD cells. CAD cells were transfected with both GFP-NET and various mCherry-Rab11a/b mutants. Shown are single confocal sections of axonal swellings of GFP-NET (top row) and Rab11a (middle row) and colocalization visualized in the merged images (bottom row). The mutant version is indicated above each column. B, Shown are single confocal sections of axonal swellings of GFP-NET (top row) and Rab11b (middle row) and colocalization visualized in the merged images (bottom row). The mutant version is indicated above each column. C, Colocalization was quantitated using the ICQ method as outlined in Materials and Methods (Li et al., 2004), demonstrating that the colocalization of NET and Rab11a/b depends on Rab11 function. D, Shown are single confocal sections of cell bodies of double-transfected CAD cells with GFP-NET and the relevant mCherry-tagged protein. GFP-NET is in the first column, and Rab11 functional modifiers in the second column, Alexa 633-transferrin (Tfn) in the third column, and the triple-merged image in the last column. The name of the mutant is given to the panel of the row of the relevant images (ΔC2, mCherry-FIP2ΔC; S25N, mCherry-Rab11aS25N; S29F, mCherry-Rab11aS29F). E, Colocalization was quantitated using the ICQ method as outlined in Materials and Methods (Li et al., 2004), demonstrating that the distribution of NET and Tfn differentially depend on Rab11 function. Error bars indicate SEM.
Figure 8.
Figure 8.
Expression of FIP2ΔC2 in NET cells prevents AMPH-induced internalization of NET. A, FIP2ΔC2 in NET cell is found mainly in the expected perinuclear regions. Scale bar, 50 μm. B, Control (CTR) (vector-transfected) and FIP2ΔC2-transfected NET cells were treated with vehicle or AMPH for 10 or 30 min, and cell surface NET was determined by biotinylation assays. Displayed is an immunoblot of biotinylated (surface NET) and total NET fractions from a representative experiment. C, A graph of the quantitation of pooled data (N = 7) obtained from NET cells, vector (CTR)- or FIP2ΔC2-transfected, treated with vehicle or AMPH for 10 and 30 min. Data were normalized to total proteins and expressed as a percentage of control. Error bars indicate SEM.

Similar articles

Cited by

References

    1. Ahmed BA, Jeffus BC, Bukhari SI, Harney JT, Unal R, Lupashin VV, van der Sluijs P, Kilic F. Serotonin transamidates Rab4 and facilitates its binding to the C terminus of serotonin transporter. J Biol Chem. 2008;283:9388–9398. - PubMed
    1. Apparsundaram S, Galli A, DeFelice LJ, Hartzell HC, Blakely RD. Acute regulation of norepinephrine transport: I. Protein kinase C-linked muscarinic receptors influence transport capacity and transporter density in SK-N-SH cells. J Pharmacol Exp Ther. 1998a;287:733–743. - PubMed
    1. Apparsundaram S, Schroeter S, Giovanetti E, Blakely RD. Acute regulation of norepinephrine transport: II. PKC-modulated surface expression of human norepinephrine transporter proteins. J Pharmacol Exp Ther. 1998b;287:744–751. - PubMed
    1. Bauman AL, Apparsundaram S, Ramamoorthy S, Wadzinski BE, Vaughan RA, Blakely RD. Cocaine and antidepressant-sensitive biogenic amine transporters exist in regulated complexes with protein phosphatase 2A. J Neurosci. 2000;20:7571–7578. - PMC - PubMed
    1. Becker KP, Hannun YA. cPKC-dependent sequestration of membrane-recycling components in a subset of recycling endosomes. J Biol Chem. 2003;278:52747–52754. - PubMed

Publication types

MeSH terms

LinkOut - more resources