. 2010 Jun 9;30(23):7961-74.
doi: 10.1523/JNEUROSCI.6170-09.2010.

Notch activity levels control the balance between quiescence and recruitment of adult neural stem cells

Affiliations

Notch activity levels control the balance between quiescence and recruitment of adult neural stem cells

Prisca Chapouton et al. J Neurosci. .

Abstract

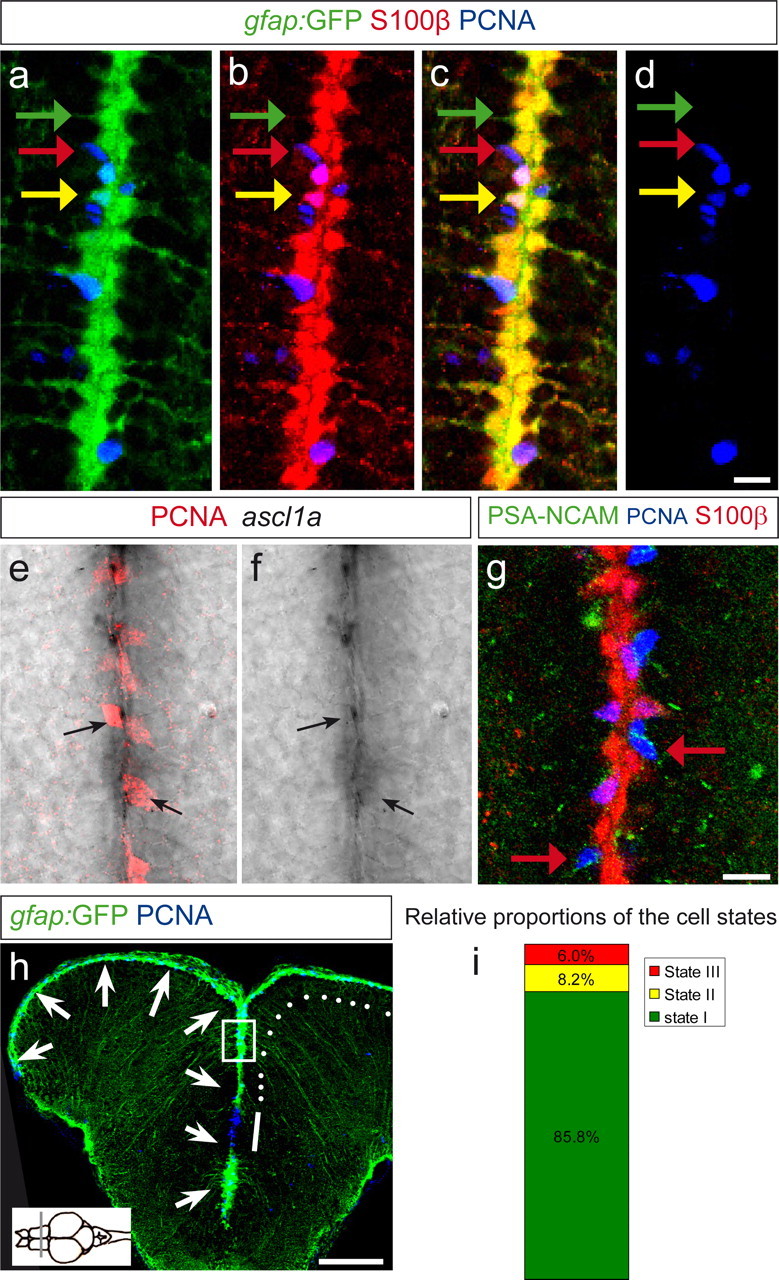
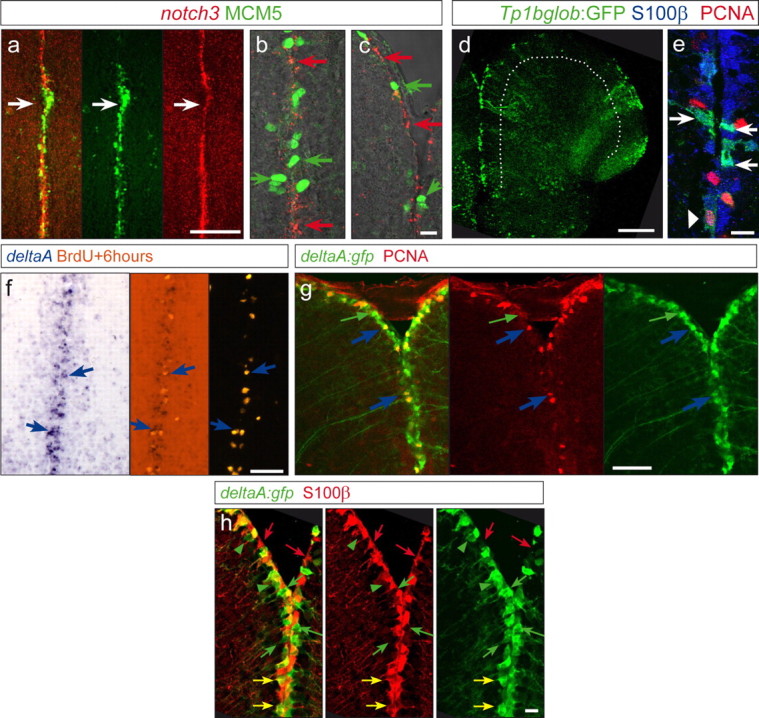
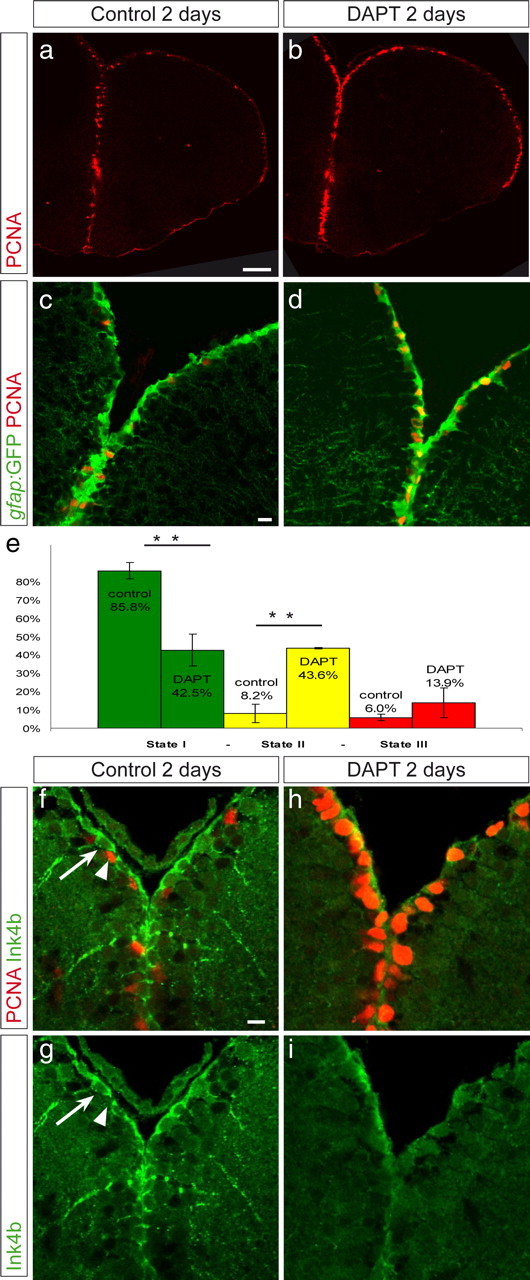
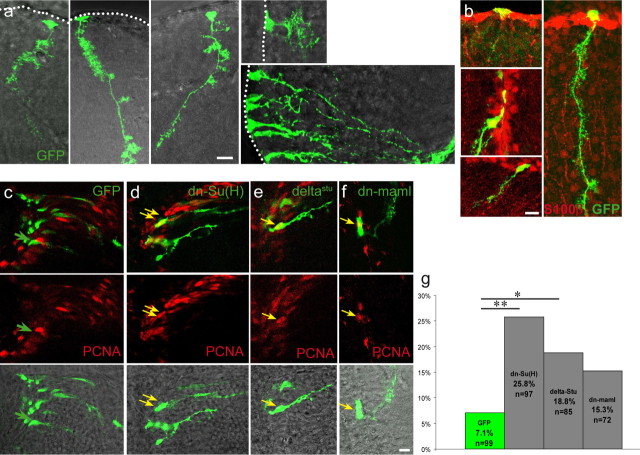
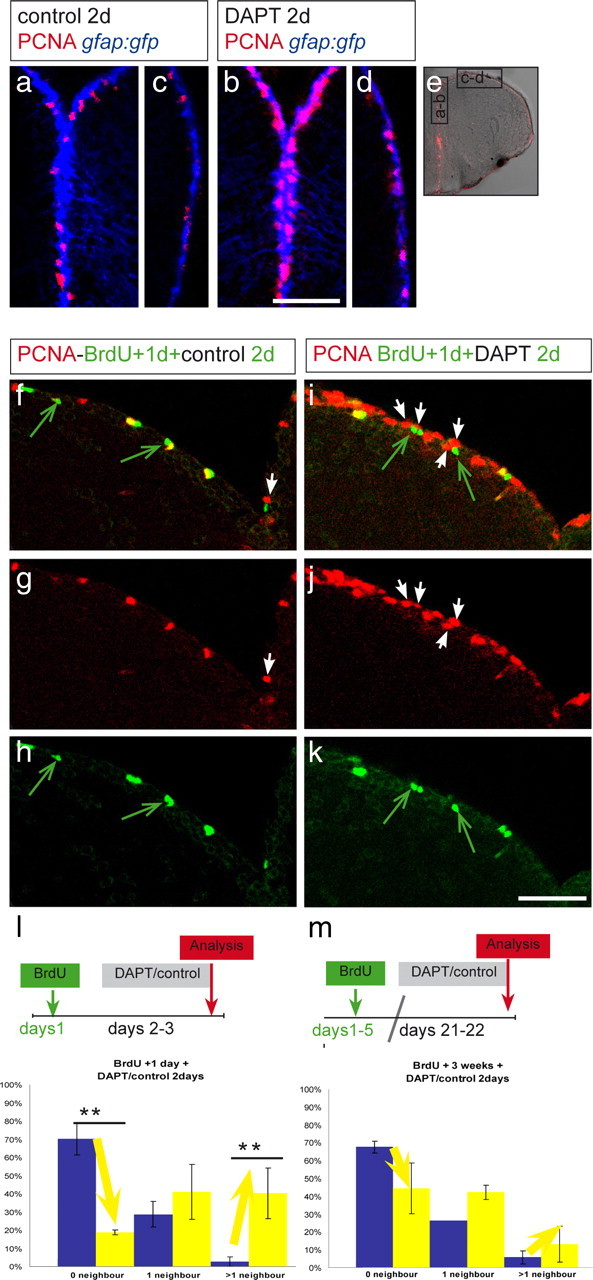
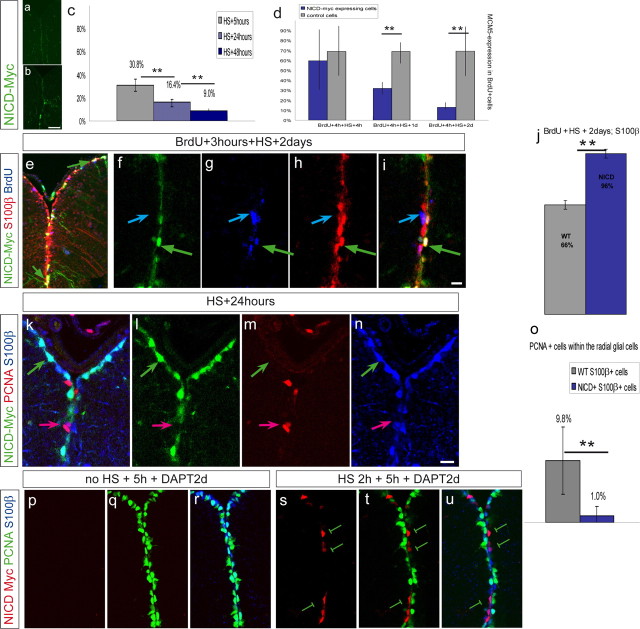
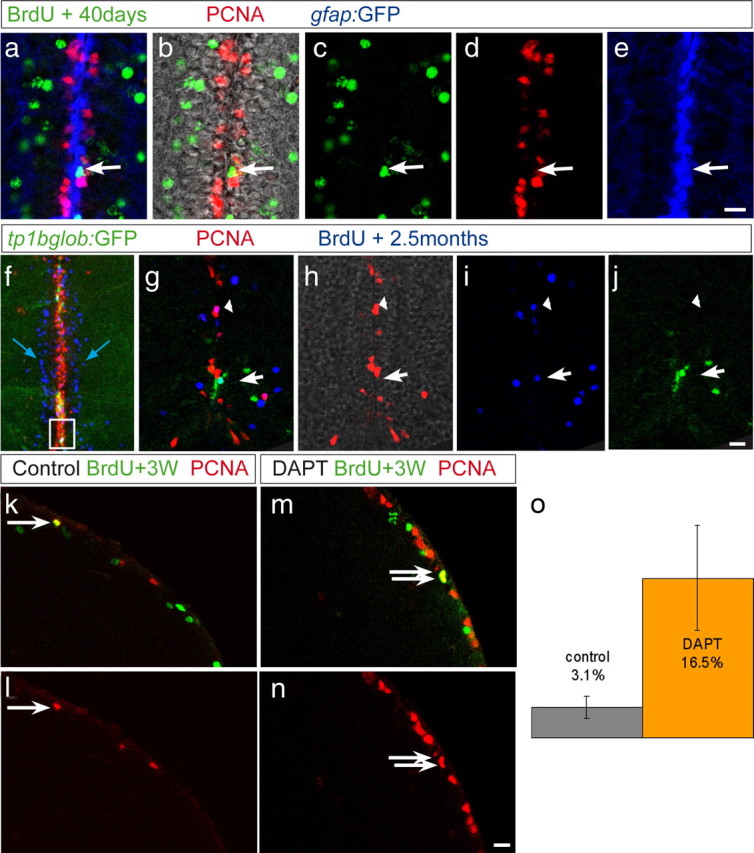
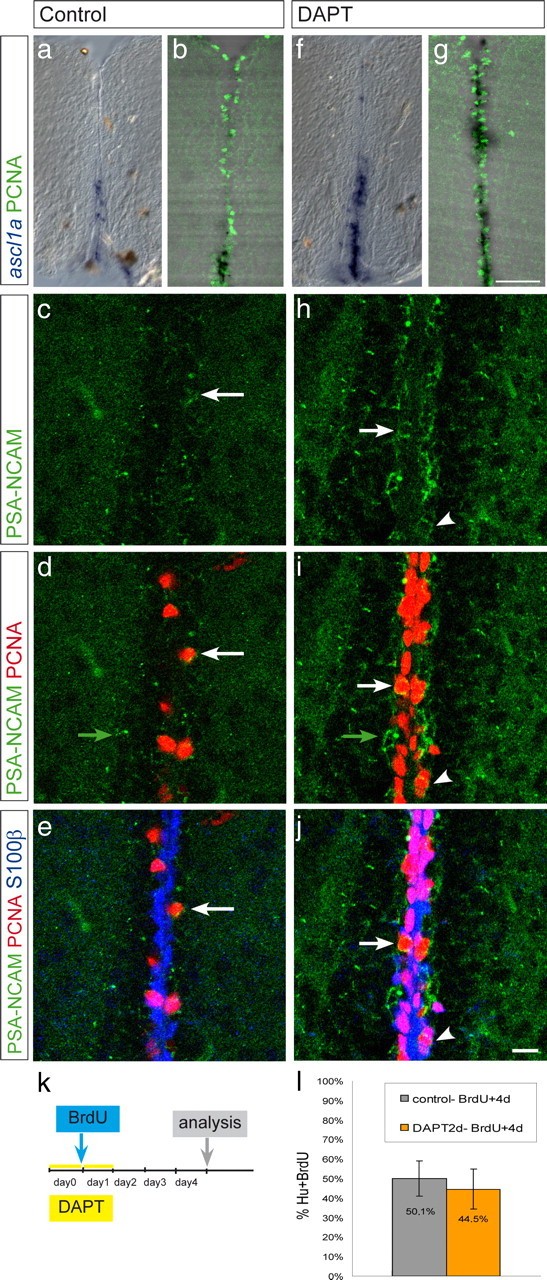
The limited generation of neurons during adulthood is controlled by a balance between quiescence and recruitment of neural stem cells (NSCs). We use here the germinal zone of the zebrafish adult telencephalon to examine how the frequency of NSC divisions is regulated. We show, using several in vivo techniques, that progenitors transit back and forth between the quiescent and dividing state, according to varying levels of Notch activity: Notch induction drives progenitors into quiescence, whereas blocking Notch massively reinitiates NSC division and subsequent commitment toward becoming neurons. Notch activation appears predominantly triggered by newly recruited progenitors onto their neighbors, suggesting an involvement of Notch in a self-limiting mechanism, once neurogenesis is started. These results identify for the first time a lateral inhibition-like mechanism in the context of adult neurogenesis and suggest that the equilibrium between quiescence and neurogenesis in the adult brain is controlled by fluctuations of Notch activity, thereby regulating the amount of adult-born neurons.


Figures

Figure 1.
Figure 1.
The telencephalon neurogenic zone contains three cell states. Telencephalic cross sections at the anteroposterior level indicated in the inset on the bottom left in h. a–d, Single optical section in a gfap:GFP transgenic brain section, immunostained for GFP (green), S100β (red), and PCNA (blue), depicting a close-up view on the ventricular surface at the midline between the two brain hemispheres. gfap:GFP and S100β are coexpressed in all radial glial cells (yellow in c). Three cell states are visible: the majority of radial glial cells are noncycling (PCNA-negative; green arrow, state I cells). Some radial glial cells are PCNA positive (yellow arrow, state II cells). Some cells express only PCNA and no radial glial marker (red arrow, state III cells). e–g, State III cells express markers of neuroblasts. e, f, Expression of ascl1a revealed by in situ hybridization (black signal), revealing colocalization with PCNA (red). g, PSA-NCAM antibody staining (green) labels many state III cells, as shown by red arrows, revealing their identity of migrating neuroblasts. h, Overview of a gfap:GFP telencephalic section in a confocal stack projection, stained for GFP (green) and PCNA (blue). The arrows depict the telencephalic ventricle, located at the surface and at the midline. The boxed area depicts the region shown in a–g. The white line depicts the pallial–subpallial border region, in which mostly state III cells are located. The white dots depict the pallial ventricular region in which states I, II, and III are intermingled. This latter region is quantified in i and examined further in the next experiments. i, Relative proportions of state I, II, and III cells, counted in 2845 VZ cells of four brains. Scale bars: (in d) a–d, 10 μm; (in g) e–g, 10 μm; h, 100 μm.
Figure 2.
Figure 2.
Expression of notch3 and the Notch reporter transgenic line highlight state I cells, whereas proliferating progenitors express deltaA. a–c, notch3a in situ hybridization (red signal) and MCM5 (green, proliferation marker) in the midline of the telencephalon showing a complementary expression: regions with dense expression of MCM5 express lower levels of notch3 (white arrow in a), and high magnifications (b, c) reveal a complementary expression at the single-cell level. d, Cross sections, as a projection of a confocal stack, of a TP1bglob:gfp transgenic telencephalon, highlighting activation of RBPJ targets/canonical Notch signaling (green) along the VZ (the VZ is underlined by the white dotted line). e, GFP-positive cells colocalize with S100β (blue). Only a few (6%) weak GFP-positive cells (arrowhead) colocalize with S100β/PCNA double-positive cells (PCNA in red). f, g, Dividing cells marked by a BrdU pulse 6 h before analysis (orange, f) or by PCNA (red, g) express the Notch-ligand DeltaA (blue arrows), as visible by in situ hybridization (f, blue signal) and in the deltaA:gfp transgenic line (g, green; 95% of the PCNA-positive cells are GFP positive). The green arrow in g depicts also deltaA:GFP cells that are PCNA negative (64% of the GFP-positive cells are PCNA negative). h, Expression of deltaA:GFP (green) compared with S100β-positive radial glia (red). Green arrows point to single GFP-positive cells, and red arrows point to cells expressing S100β only. The majority of labeled cells are double-positive cells and appear yellow in the first panel (yellow arrows, 75% of deltaA:GFP cells are S100β positive). Scale bars: a, d, 100 μm; c, e, h, 10 μm; f, g, 50 μm.
Figure 3.
Figure 3.
Inhibition of Notch activity triggers a state I to II switch. Vehicle-treated fish (a, c, f, g) and fish treated with 40 μm DAPT (b, d, h, i) were compared. a, b, Overview on a telencephalic cross section, as a single confocal plane, of a gfap:GFP fish stained for PCNA (red), revealing the increased density of PCNA-positive cells along the ventricular zone in DAPT-treated fish. c, d, Dorsal telencephalic ventricular zone of gfap:GFP, control (c), or DAPT-treated (d) fish, revealing an increase in state II cells (PCNA, red; GFP, green) within the GFAP-positive cell population. e, The relative proportions of states I, II, and III cells were calculated in n = 4 control brains (2845 cells) and n = 3 DAPT-treated brains (3199 cells). The difference between control and DAPT is highly significant for state I and state II cells (t test, **p < 0.001). The density of GFAP-positive cells per ventricular surface was unchanged. Error bars show the SEM (n = 4 and 3). f–i, DAPT-treated (h, i) and vehicle-treated (f, g) brains were immunostained for Ink4b (green). Ink4b is found in noncycling cells (arrow) but not in PCNA-positive cells. Ink4b expression disappeared during DAPT treatment. Scale bars: a, 50 μm; c, f, 10 μm.
Figure 4.
Figure 4.
In vivo transfection via lipofection and electroporation of dominant-negative constructs of the Notch pathway induces an increase of PCNA-positive cells. The ventricular zone of the telencephalon in adult fish was lipofected or electroporated with constructs in the pCS2 vector expressing eGFP (a–c) or was coelectroporated with pCS2–eGFP together with pCS2–dn-Su(H) (d), pCS2–deltastu (e), or pCS2–dn-maml1 (f). a and b depict the morphology and S100β expression (b) of transfected radial glia, which can be evaluated as individual cells. Transfected cells in c–f were assessed for their expression of PCNA (red) 2 d after electroporation; green arrows point to single GFP-positive cells, and yellow arrows point to GFP and PCNA double-positive cells. The percentage of GFP-positive cells also expressing PCNA is plotted in g for the different constructs. Note that all three dominant-negative proteins with Notch blockade activity increase cell cycle entry. In the case of dn-Su(H) and DeltaStu, this increase reaches significance (p = **0.0004 and *0.02, respectively, Fisher's exact test). n is the total number of cells counted of 5–10 brains per construct. Scale bars, 10 μm.
Figure 5.
Figure 5.
Notch maintains quiescence in cells neighboring active progenitors. DAPT-treated (b, d, i–k) or vehicle-treated (a, c, f–h) fish were compared. e, Overview of a telencephalic cross section. Black rectangles depict regions enlarged in a–d. a, b, Medial ventricular area, containing dividing progenitors (PCNA, red) under normal conditions (a) and a higher density of PCNA-positive cells after DAPT (b). c, d, Dorsolateral area of the telencephalon (as boxed in e; medial is to the top and lateral to the bottom) containing few PCNA-positive cells under normal conditions (c) and a slight increase of PCNA-positive cells after DAPT (d). The proportion of PCNA-positive cells reaches a higher level in medial regions under Notch-blocking conditions. f–k, Dorsomedial region harboring a density of PCNA-positive cells comparable with the region in a. BrdU was administered twice within 3 h, and 1 d later, the fish were treated with vehicle (f–h) or DAPT water (i–k) for 2 d. Cells neighboring BrdU-positive cells were analyzed for PCNA expression. Few BrdU-labeled cells in control brains are in contact with newly dividing, PCNA-positive cells (white arrow, f, g), and many BrdU-positive cells (some of them are still PCNA positive; yellow) have no PCNA-positive (red) neighbor (green arrows, f, h). Most BrdU-labeled cells after DAPT are surrounded by PCNA-positive cells (arrows in i–k), suggesting that Notch prevents neighbors of an already dividing cell to enter cell cycle. The amount of BrdU-positive cells is unchanged, suggesting that the cell cycle speed has not been changed by the DAPT treatment. l, m, BrdU-labeled cells, counted in two brains for each condition, were categorized in three groups according to their neighbors: no dividing neighbor, one dividing neighbor, and more than one dividing neighbor. The proportion of cells belonging to each category is represented, and the error bars represent the SEM, in which n is number of brains. The blue bar of each category represents vehicle-treated and the yellow bar DAPT-treated animals. l, In DAPT-treated animals, the proportion of BrdU-positive, 3-d-labeled cells without dividing neighbor is decreased, whereas the proportion of BrdU-labeled cells with more than one neighbor is increased (one-way ANOVA for repeated measurements; 6 sections from 2 control brains and 4 sections from 2 DAPT brains; **p < 0.01 for 0 neighbors, **p = 0.02 for 2 or more neighbors). m, Fish were injected for 5 d with BrdU and treated 3 weeks after the last injection with DAPT or with DMSO. The neighbors from these BrdU-positive, 3-week-labeled cells did not reveal a significant difference after DAPT treatment compared with control treatment. The nonsignificant changes observed are probably attributable to the general increase of dividing cells along the VZ. Scale bars: in a for a–d, in f for f–k, 100 μm.
Figure 6.
Figure 6.
NICD expression induces a switch from state II to state I. Double-transgenic fish carrying hsp70:gal4 and uas:nicd–myc were submitted to HS for 2.5 h at 38°C. Expression of NICD–Myc fusion protein is revealed by Myc antibody staining on telencephalic cross sections, as depicted in green (a–n) or red (p–u). a, b, Anti-Myc staining in a transgenic fish without HS (a) and with HS (b), indicating that the transgene is not or is only weakly expressed before HS. c, Fish were killed 5, 24, and 48 h after the end of the HS. The percentage of dividing cells (expressing MCM5) was calculated, in three independent experiments. The proportion of dividing cells significantly decreases with increasing time of NICD expression (n = 3 brains each with a total of 444, 1884, and 1540 counted cells for the respective time points; **p = 0.012, one-way ANOVA). d, In two independent experiments, BrdU was administered 3 h before HS to trace NICD–Myc-expressing (blue bars) and neighboring wild-type (gray bars) cells that had just divided. The proportion of such cells that remained positive for MCM5 was calculated. Control BrdU-labeled cells essentially remained MCM5-positive over 2 d, but NICD-expressing BrdU-labeled cells rapidly exited the cell cycle (5–11 sections per brain from 2 brains for each time point; significant decrease for the second and third time point, paired t test for repeated measurements, **p < 0.01). The three time points are significantly different from each other (interaction term in repeated measurement two-way ANOVA, p < 0.01). e–j, BrdU was administered 3 h before HS. At 2 d after HS, the proportion of BrdU-positive cells (blue) expressing S100β (red) within the NICD–Myc-positive population (green), quantified in i, is higher than within the neighboring control population. The green arrow in f–i depicts a Myc+ BrdU+ cell that is S100β positive, while the Myc-negative BrdU+ cell depicted by the blue arrow is S100β positive. j, Quantification (n = 4 sections, 178 Myc+S100β+ cells, 407 Myc(−)S100β+ cells, **p < 0.01, paired t test). k–o, One day after HS, the proportion of S100β+ (red), PCNA+ (blue) cells (state II cells) within the total S100β+ population was significantly decreased in the NICD-Myc+ (green) compared to the NICD-Myc-negative population (n = 2 brains, total of 572 Myc+ and 1701 Myc-negative cells counted in 11 sections, **p < 0.01, paired t test for repeated measurements). Scale bars: b, 50 μm; i, m, 10 μm. The error bars represent the SEM, with n = number of brains (c, d, o) or number of sections (j). p–u, NICD expression can rescue the effect of DAPT. Transgenic animals were subject to a 2 h HS (s–u) or no HS (p–r) followed by a 5 h pause and a 2 d DAPT treatment. The division status (PCNA expression, green) of Myc-negative radial glia (expressing S100β, blue) or Myc-positive radial glia (anti-Myc immunocytochemistry, red) was then assessed. Note that all Myc-positive glia are negative for PCNA (n = 113 Myc-positive cells counted out of 8 sections from three brains; some examples are indicated by the green bars). Hence, they fail to induce cell cycle upon DAPT treatment, in contrast to Myc-negative glia in non-heat-shocked (p–r) or heat-shocked (s–u) animals.
Figure 7.
Figure 7.
State II cells endogenously transit to state I and back to state II, according to Notch activity. a–e, Cross section of a gfap:GFP transgenic fish (GFP in blue) treated with BrdU for 5 d and killed 40 d after the last injection. Some BrdU-labeled cells (green) remain in the ventricular area but are PCNA (red) negative, as pointed to by the arrow, indicating that they have entered state I after having divided. f–j, TP1bglob:gfp transgenic fish treated with BrdU for 5 d and killed 2.5 months later. f, Projection of several confocal planes, overview of the telencephalic midline: Many BrdU+ cells (blue) have exited from the ventricular zone containing PCNA+ cells (red) and have entered the parenchyma (blue arrow). g–j, Single optical section showing the area boxed in f. Some BrdU+, PCNA-negative cells remaining in the ventricular area are GFP+ (white arrow), indicating that they have entered state I and are under high Notch signaling. k–o, WT fish were injected with BrdU for 5 d and treated 3 weeks later for 2 d with DAPT or control water. Brains were stained for BrdU (green) and PCNA (red). o, The proportion of BrdU+, PCNA+ cells within the ventricular BrdU+ population was calculated in two control and two DAPT-treated brains. After DAPT treatment, this proportion is increased by 5 times compared to the control, indicating that Notch signaling had kept label-retaining cells quiescent. Error bars represent SEM, n = 2 with a total number of 217 control and 235 DAPT-treated BrdU+ cells, p < 0.01, Rao-Scott test (modified χ2 test for clustered data). Scale bars (e, j, n), 10 μm.
Figure 8.
Figure 8.
Notch blocking induces an increased number of neuroblasts. Cross sections through the telencephalon of wild-type animals, treated with vehicle only (a–e) or with DAPT (f–j). a, b, f, g, In situ hybridization with the ascl1a antisense probe (blue in a and f and black in b and g). DAPT treatment induces an increased number of dividing cells undergoing neurogenesis. c–e, h–j, PSA-NCAM (green), PCNA (red), and S100β (blue), merged in e and j. DAPT treatment induces an increased number of PCNA+, PSA-NCAM+ cells (state III cells, white arrow) and of cells only positive for PSA-NCAM (likely differentiating neurons, green arrow). S100β, PCNA, PSA-NCAM triple-labeled cells are also increased under DAPT conditions (arrowhead), suggesting an accelerated switch from state II to state III. k, Dividing cells in 2 control- and 2 DAPT-treated fish were traced for 4 d after BrdU injection. The proportion of BrdU+, Hu+ cells is similar in control and treated brains, indicating that the reactivation of state I cells by DAPT is followed by normal neuronal maturation, and that consequently the net number of generated neurons is increased. Scale bars: g, 50 μm; j, 10 μm.

Similar articles

Cited by

References

    1. Adolf B, Chapouton P, Lam CS, Topp S, Tannhäuser B, Strähle U, Götz M, Bally-Cuif L. Conserved and acquired features of adult neurogenesis in the zebrafish telencephalon. Dev Biol. 2006;295:278–293. - PubMed
    1. Aizawa H, Goto M, Sato T, Okamoto H. Temporally regulated asymmetric neurogenesis causes left-right difference in the zebrafish habenular structures. Dev Cell. 2007;12:87–98. - PubMed
    1. Baek JH, Hatakeyama J, Sakamoto S, Ohtsuka T, Kageyama R. Persistent and high levels of Hes1 expression regulate boundary formation in the developing central nervous system. Development. 2006;133:2467–2476. - PubMed
    1. Bernardos RL, Raymond PA. GFAP transgenic zebrafish. Gene Expr Patterns. 2006;6:1007–1013. - PubMed
    1. Bernardos RL, Lentz SI, Wolfe MS, Raymond PA. Notch-Delta signaling is required for spatial patterning and Muller glia differentiation in the zebrafish retina. Dev Biol. 2005;278:381–395. - PubMed

Publication types

MeSH terms

Substances

LinkOut - more resources