. 2010 Jun 9;30(23):8048-56.
doi: 10.1523/JNEUROSCI.0770-10.2010.

Differential involvement of excitatory and inhibitory neurons of cat motor cortex in coincident spike activity related to behavioral context

Affiliations

Differential involvement of excitatory and inhibitory neurons of cat motor cortex in coincident spike activity related to behavioral context

David Putrino et al. J Neurosci. .

Abstract

To assess temporal associations in spike activity between pairs of neurons in the primary motor cortex (MI) related to different behaviors, we compared the incidence of coincident spiking activity of task-related (TR) and non-task-related (NTR) neurons during a skilled motor task and sitting quietly in adult cats (Felis domestica). Chronically implanted microwires were used to record spike activity of MI neurons in four animals (two male and two female) trained to perform a skilled reaching task or sit quietly. Neurons were identified as TR if spike activity was modulated during the task (and NTR if not). Based on spike characteristics, they were also classified as either regular-spiking (RS, putatively excitatory) or fast-spiking (FS, putatively inhibitory) neurons. Temporal associations in the activities of simultaneously recorded neurons were evaluated using shuffle-corrected cross-correlograms. Pairs of NTR and TR neurons showed associations in their firing patterns over wide areas of MI (representing forelimb and hindlimb movements) during quiet sitting, more commonly involving RS neurons. During skilled task performance, however, significantly coincident firing was seen almost exclusively between TR neurons in a smaller part of MI (representing forelimb movements), involving mainly FS neurons. The findings of this study show evidence for widespread interactions in MI when the animal sits quietly, which changes to a more specific and restricted pattern of interactions during task performance. Different populations of excitatory and inhibitory neurons appear to be synchronized during skilled movement and quiet sitting.


Figures

Figure 1.
Figure 1.
Spike detection and classification of RS and FS neurons. Unit isolation was performed using level detection and window discrimination. A, Spike trains of an RS (top trace) and FS (bottom trace) shown with a level detector. Calibration: A, 100 μV, 200 ms; B (in A), 150 μV, 250 μs. B, Overlaid waveforms of the two neurons shown alongside. C, Differences in spike duration between RS (black) and FS (gray) neurons. The average spike width of each neuron was calculated after measuring the duration between the two troughs of 40–60 spikes. D, When the spike width and baseline firing rate information for all recorded neurons was plotted and compared, two clearly distinguishable neuronal populations, classified RS (open circles) and FS (filled circles) neurons, were identified.
Figure 2.
Figure 2.
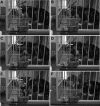
Task stages, quiet sitting, and recording setup. Photographs of the prehensile task performed in a shielded cage by one animal during different stages of the task are shown. The task was divided into five stages: the background stage (A), when the animal waited expectantly; the premovement stage (B) between the delivery of the food pellet and the instant the reaching forepaw moved up; the reach stage (C), which ended when the paw rested on the food pellet; the withdraw stage (D), when the food was dragged out from between the upright barriers, which ended when the paw was lifted off the pellet; and the early part of the feeding stage (E), when the animal bent its head down to pick up the pellet. During quiet sitting, the animal did not expect and was not given any food reward (F).
Figure 3.
Figure 3.
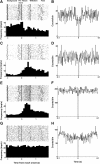
Examples of PSTHs and autocorrelograms of recorded neurons. Rasters and PSTHs (bin width 0.1 s) of two simultaneously recorded TR neurons (A, C), as well as a simultaneously recorded pair of TR (E) and NTR (G) neurons, are displayed in this figure. Rasters show neural spikes (gray dots) as well as the start of each task stage (black diamonds). Rasters and PSTHs have been aligned to the start of reach. The autocorrelograms (bin width 0.001 s) of the same neurons are displayed alongside (B, D, F, H), showing no evidence of oscillatory activity in the isolated units.
Figure 4.
Figure 4.
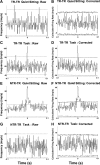
Examples of raw and shuffle-subtracted cross-correlograms computed between pairs of neurons during quiet sitting and task performance. Raw (A, C, E, G) and shuffle-corrected (B, D, F, H) cross-correlograms (bin width 0.001 s) were computed between the simultaneously recorded pairs of neurons displayed in Figure 3 during quiet sitting (A, B, E, F) and task performance (C, D, G, H). For examining coincident spike activity during task performance, cross-correlograms were computed for the following stages of the task: premovement, reach, withdraw, and feed. Correlograms computed for the background stage are not shown. Note the differences between the raw and shuffle corrected cross-correlograms after subtraction of the “shift predictor.” The shift predictor was averaged over all possible permutations. Note the narrow peak that reaches significance in the second correlogram (D), indicating a significant firing pattern association between TR–TR neurons occurring specifically during task performance. Next, consider the correlograms of simultaneously recorded NTR and TR neurons, during the quiet sitting (F) and task (H) periods. Note that in this case, there is a broad peak that reaches significance in the first correlogram (F), indicating a significant firing pattern association that occurs during quiet sitting.
Figure 5.
Figure 5.
Incidence of significant associations in neural activity during different behavioral conditions. The number of neuronal pairs that showed significantly coincident spike activity (expressed as a percentage of the total number of tested pairs) is illustrated as histograms for NTR–NTR, NTR–TR, and TR–TR neuronal pairs during different behavioral conditions.
Figure 6.
Figure 6.
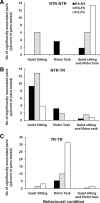
Effect of cell subtype and task-related function on incidence of correlation. The frequency (expressed as a percentage of the total number of tested pairs) of significant associations in neural activity observed among different combinations of neuronal subtypes (RS, FS) is illustrated in NTR–NTR (A), NTR–TR (B), and TR–TR (C) neuronal pairings during different behavioral conditions.
Figure 7.
Figure 7.
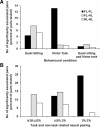
Limb representation and the incidence of correlation. A, Differences in the rates (as a percentage of the total number of tested pairs) of coincident firing patterns are seen when neuronal pairs are grouped according to limb representation as FL–FL, HL-FL, or HL–HL during different behavioral conditions. B, The pairing of neurons as NTR–NTR, NTR–TR, or TR–TR appeared to influence the incidence of associations that were detected between FL–FL, HL-FL, or HL–HL pairings.
Figure 8.
Figure 8.
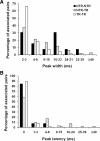
Distribution of peak widths (A) and latencies (B) for all of the correlograms that reached significance in this study. The pairings of different neuronal types (NTR–NTR, NTR–TR, and TR–TR) are indicated by the different bar colors, and the numbers of peak latencies and widths are represented as percentages of the total number of significant associations in each pairing.
Figure 9.
Figure 9.
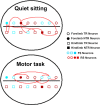
Significant associations in MI neural networks. Pictorial representation of the pattern of coincident spike activities seen between neurons with different functions during a typical recording session from one hemisphere. The horizontal black line is a simplified representation of the cruciate sulcus, which divides the cat MI anatomically into rostral and caudal 4γ. Each recorded neuron has three attributes indicated by the shape (circle, forelimb representation; square, hindlimb representation), filling (filled, NTR; unfilled, TR), and color (blue, FS; red, RS) of the symbol. In this recording, during quiet sitting we see more varied interactions between NTR and TR neuronal pairs, between FL and HL neurons, and between RS–RS and RS–FS pairs. In contrast, during task performance we see that interactions are limited to those between TR neurons from forelimb representations, and FS–FS or RS–FS pairs.

Similar articles

Cited by

References

    1. Allum JH, Hepp-Reymond M-C, Gysin R. Cross-correlation analysis of interneuronal connectivity in the motor cortex of the monkey. Brain Res. 1982;231:325–334. - PubMed
    1. Bair W, Koch C, Newsome W, Britten K. Power spectrum analysis of bursting cells in area MT in the behaving monkey. J Neurosci. 1994;14:2870–2892. - PMC - PubMed
    1. Baker SN, Spinks R, Jackson A, Lemon RN. Synchronization in monkey motor cortex during a precision grip task. I. Task dependant modulation in single unit synchrony. J Neurophysiol. 2001;85:869–885. - PubMed
    1. Baranyi A, Szente MB, Woody CD. Electrophysiological characterization of different types of neurons recorded in vivo in the motor cortex of the cat. I. Patterns of firing activity and synaptic responses. J Neurophysiol. 1993;69:1850–1864. - PubMed
    1. Biswal B, Yetkin FZ, Haughton VM, Hyde JS. Functional connectivity in the motor cortex of resting human brain using echo-planar MRI. Magn Reson Med. 1995;34:537–541. - PubMed

Publication types

LinkOut - more resources