. 2010 Aug;6(6):702-10.
doi: 10.4161/auto.6.6.12376. Epub 2010 Aug 14.

Short-term fasting induces profound neuronal autophagy

Affiliations

Short-term fasting induces profound neuronal autophagy

Mehrdad Alirezaei et al. Autophagy. 2010 Aug.

Abstract

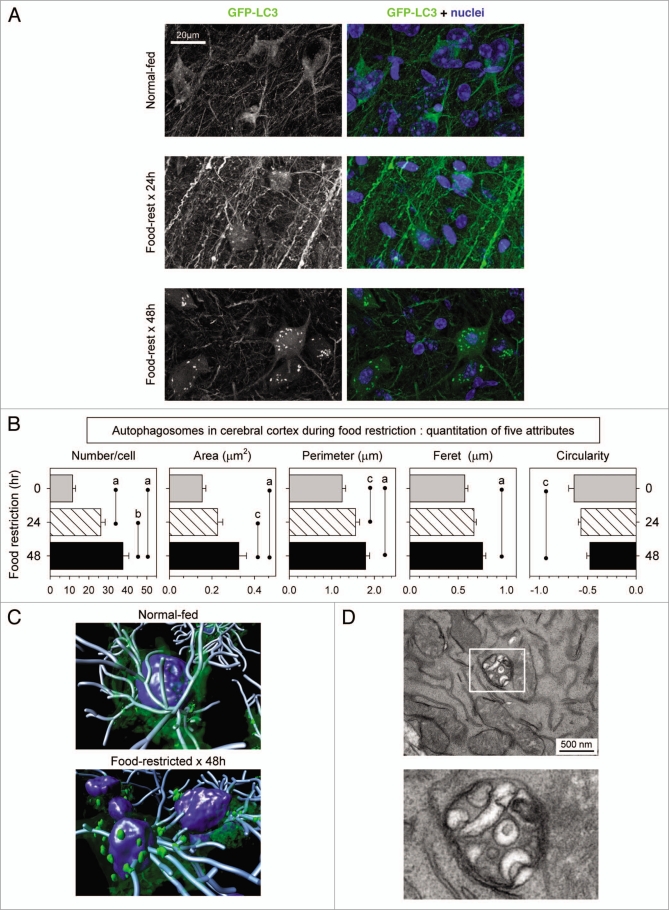
Disruption of autophagy--a key homeostatic process in which cytosolic components are degraded and recycled through lysosomes--can cause neurodegeneration in tissue culture and in vivo. Upregulation of this pathway may be neuroprotective, and much effort is being invested in developing drugs that cross the blood brain barrier and increase neuronal autophagy. One well-recognized way of inducing autophagy is by food restriction, which upregulates autophagy in many organs including the liver; but current dogma holds that the brain escapes this effect, perhaps because it is a metabolically privileged site. Here, we have re-evaluated this tenet using a novel approach that allows us to detect, enumerate and characterize autophagosomes in vivo. We first validate the approach by showing that it allows the identification and characterization of autophagosomes in the livers of food-restricted mice. We use the method to identify constitutive autophagosomes in cortical neurons and Purkinje cells, and we show that short-term fasting leads to a dramatic upregulation in neuronal autophagy. The increased neuronal autophagy is revealed by changes in autophagosome abundance and characteristics, and by diminished neuronal mTOR activity in vivo, demonstrated by a reduction in levels of phosphorylated S6 ribosomal protein in Purkinje cells. The increased abundance of autophagosomes in Purkinje cells was confirmed using transmission electron microscopy. Our data lead us to speculate that sporadic fasting might represent a simple, safe and inexpensive means to promote this potentially therapeutic neuronal response.


Figures

Figure 1
Figure 1
Identification and quantitation of autophagosomes in the liver of food-restricted mice. GFP-LC3 transgenic mice were food-restricted (food-rest) to activate autophagy, and 24 or 48 hours later, the liver was harvested and the induction of autophagy was analyzed in vibratome-cut sections by confocal microscopy. (A) representative flattened images of GFP-LC3 signal in hepatocytes are shown; sections were stained with phalloidin and Hoechst 33342 to label F-actin and nuclei, respectively. A merged fluorescent image for each mouse is shown in the right-hand column; GFP-LC3 (green), F-actin (red), nuclei (blue). Two sets of control mice were included: wild-type C57BL/6 mice were used to determine the background level of green fluorescence, which was very low (one advantage of vibratome sections); and normal-fed GFP-LC3 mice provided a baseline for autophagic activity in the liver. (B) Quantitative analysis of autophagosomes in hepatocytes, including the number of autophagosomes/cell, as well as their area, perimeter, feret and circularity [defined as 4π(area)/(perimeter)2]. Data are shown as the average + se of 80–134 cells from 3 or 4 mice per group; ap < 0.001, bp < 0.01, cp < 0.05.
Figure 2
Figure 2
Identification and quantitation of autophagosomes in the cerebral cortex of food-restricted mice. GFP-LC3 transgenic mice were food-restricted for 24 or 48 hours, and then the brain was isolated and sagittal vibratome-cut sections were analyzed by confocal microscopy. (A) Representative flattened images of GFP-LC3 signal in cortical neurons are shown. A merged fluorescent image for each mouse is shown in the right-hand column; GFP-LC3 (green), nuclei (blue). (B) Quantitative analysis of autophagosomes in cortical neurons. Data are shown as the average + SE of 50 cells from 2 or 3 mice per group; ap < 0.001, bp < 0.01, cp < 0.05. A 3D rendering of these neurons in normal-fed and food-restricted mice is shown in (C). The isosurface tool was used to demarcate the nuclei (blue) and autophagosomes (green), and neurites were traced with filament tracker, using IMARIS software (Bitplane, Inc.). (D) A TEM image from a section of cortical neuron from a 48-hour food-restricted mouse is shown; the boxed area is enlarged to better demonstrate that the enclosed structure is double-membraned.
Figure 3
Figure 3
Identification of autophagosomes and reduction of mTOR activity in the cerebellum of food-restricted mice. (A) Low magnification flattened images of GFP-LC3 fluorescence were re-assembled to generate a complete sagittal cross-section of cerebellum from normal and food-restricted mice (left column). Higher magnification images of the white boxed regions show GFP-LC3 fluorescence in purkinje cells along the boundary between the molecular and granular layers (second column). Additionally magnified representative images of the (boxed) Purkinje cell bodies reveal finer detail and localization of the GFP-LC3 signal (far right column). A merged fluorescent image for each mouse is shown in the third column; GFP-LC3 (green), nuclei (blue), pan-neuronal marker (orange), GFAP/astrocyte marker (red). (B) Cerebellar sections were stained with an antibody specific for phospho-S6RP, a protein whose abundance varies directly with mTOR activity, and inversely with autophagy (see text).
Figure 4
Figure 4
TEM identification and quantitation of autophagosomes in Purkinje cells of normal-fed and food-restricted mice. (A) Images from Purkinje cells of normal-fed (left) or 48 hour food-restricted (middle & right) mice are shown. (B) A single Purkinje cell from a 48 hour food-restricted mouse is shown. Autophagosomes are enclosed in colored boxes, and higher-magnification images of each are provided, with autophagosomes indicated by white arrows. For both normal-fed and food-restricted mice, autophagosomes were enumerated in TEM sections of ∼20 different Purkinje cells; sections from food-restricted mice showed a ∼4-fold increase in autophagosome number (graph, bottom right; p < 0.0002 by Student's t test).

Similar articles

Cited by

References

    1. Hara T, et al. Suppression of basal autophagy in neural cells causes neurodegenerative disease in mice. Nature. 2006;441:885–889. - PubMed
    1. Komatsu M, et al. Loss of autophagy in the central nervous system causes neurodegeneration in mice. Nature. 2006;441:880–884. - PubMed
    1. Mizushima N, Levine B, Cuervo AM, Klionsky DJ. Autophagy fights disease through cellular self-digestion. Nature. 2008;451:1069–1075. - PMC - PubMed
    1. Alirezaei M, Kiosses WB, Flynn CT, Brady NR, Fox HS. Disruption of neuronal autophagy by infected microglia results in neurodegeneration. PLoS ONE. 2008;3:2906. - PMC - PubMed
    1. Orvedahl A, Levine B. Eating the enemy within: autophagy in infectious diseases. Cell Death Differ. 2009;16:57–69. - PMC - PubMed

Publication types

MeSH terms

Substances

LinkOut - more resources