. 2010 Aug;24(8):1437-44.
doi: 10.1038/leu.2010.132. Epub 2010 Jun 10.

A pharmacodynamic study of sorafenib in patients with relapsed and refractory acute leukemias

Affiliations

A pharmacodynamic study of sorafenib in patients with relapsed and refractory acute leukemias

K W Pratz et al. Leukemia. 2010 Aug.

Abstract

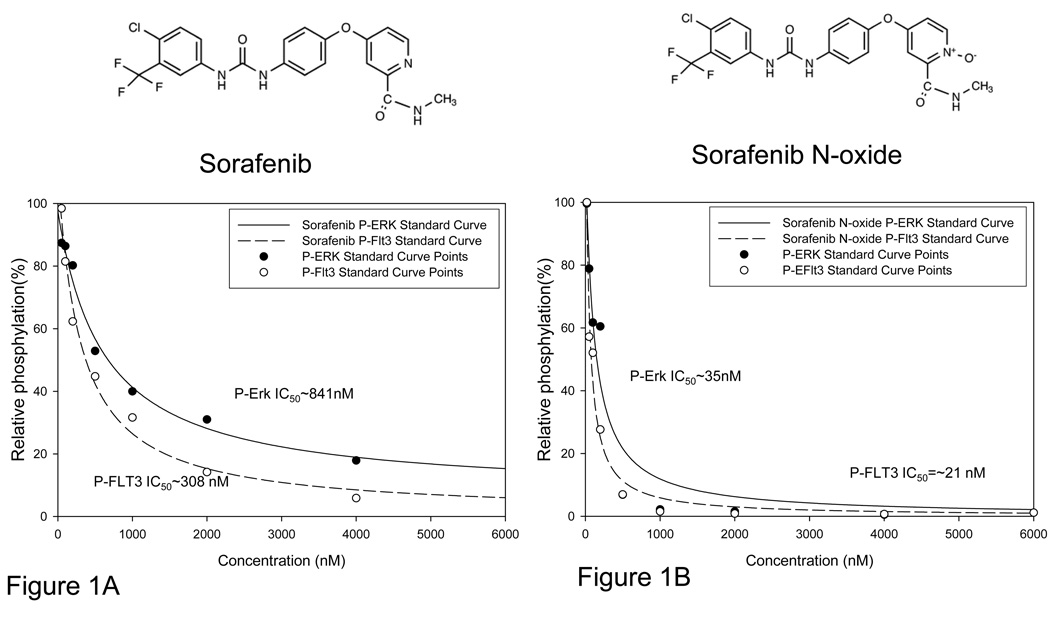
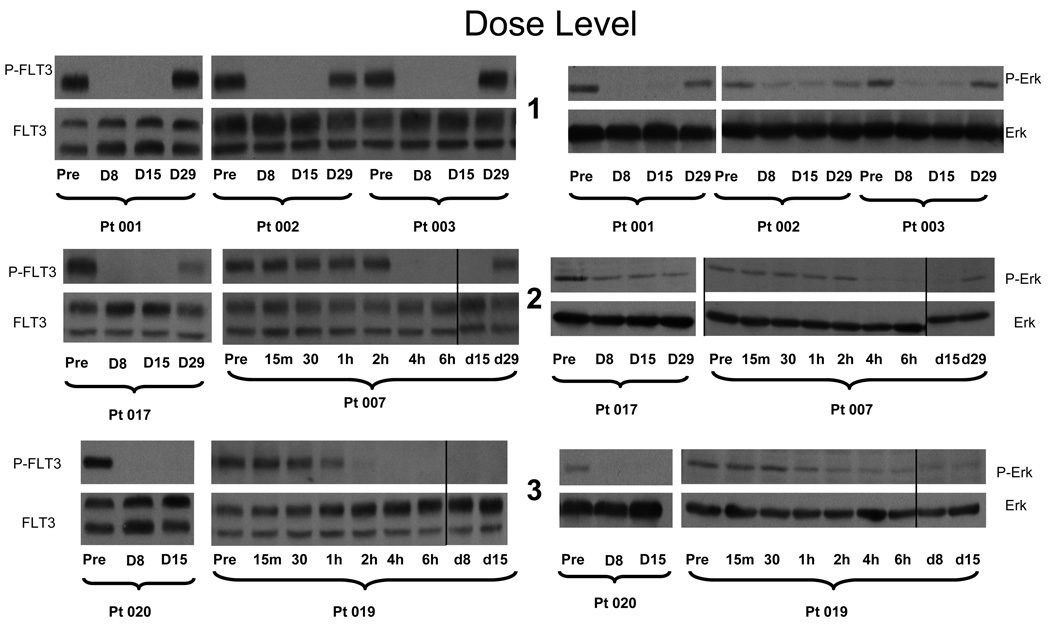
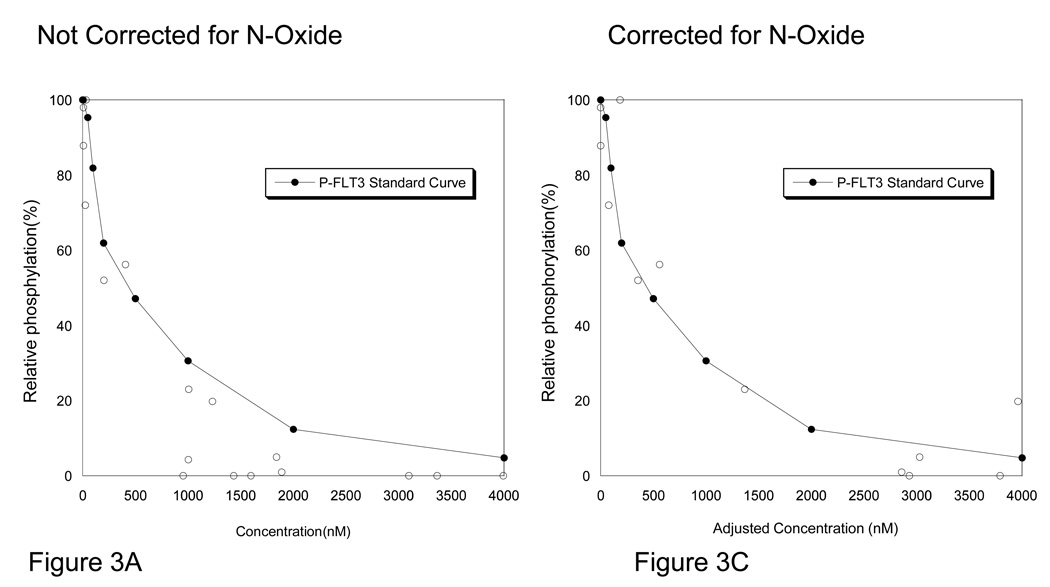
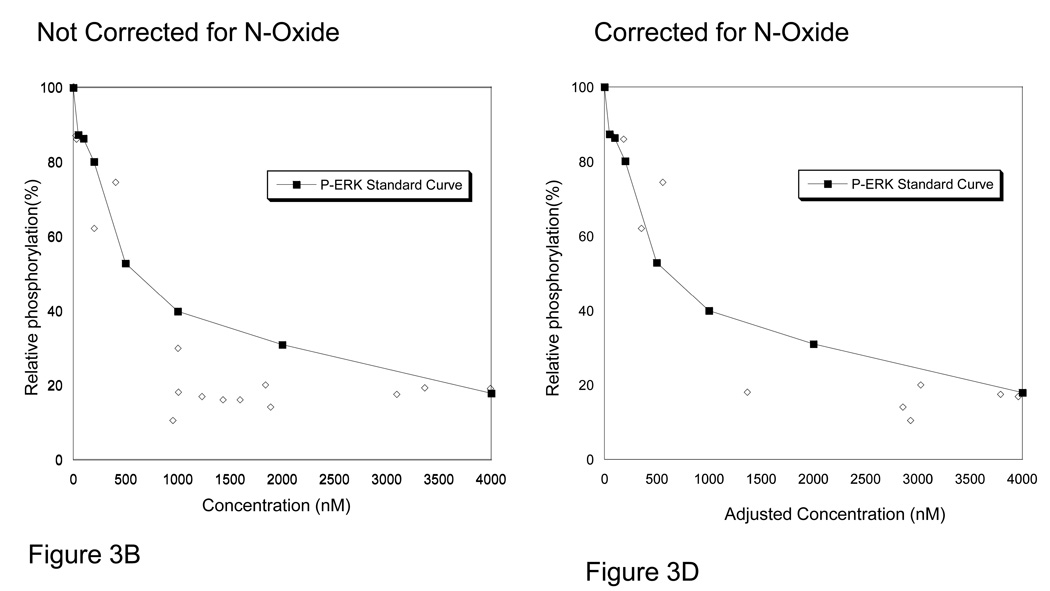
We report the results of a phase I dose escalation trial of the multikinase inhibitor sorafenib in relapsed and refractory acute leukemia patients using an intermittent dosing regimen. Fifteen patients with advanced leukemia (12 with acute myeloid leukemia, 2 with acute lymphoblastic leukemia, 1 with biphenotypic) and a median age of 63 (range 37-85) years were enrolled and treated on a dose escalation trial. Toxicities >or=grade 3 were present in 55% of cycles and the maximum tolerated dose (MTD) was determined to be 400 mg b.i.d. x 21 days in a 28-day cycle. Plasma inhibitory assays of kinase targets extracellular signal-regulated kinase (ERK) and FLT3-internal tandem duplication (ITD) showed excellent target inhibition, with FLT3-ITD silencing occurring below the MTD. The N-oxide metabolite of sorafenib seemed to be a more potent inhibitor of FLT3-ITD than the parent compound. Despite marked ex vivo FLT-3 ITD inhibition, no patients met the criteria for complete or partial response in this monotherapy study. Out of 15 patients, 11 experienced stable disease as best response. Although sorafenib showed only modest clinical activity as a single agent in this heavily treated population, robust inhibition of FLT3 and ERK suggests that there may be a potential important role in combination therapies.


Conflict of interest statement

Conflict of interests: There were no conflicts of interest to report.

Figures

Figure 1
Figure 1. Sorafenib N-oxide is a potent FLT3 inhibitor
A. Standard curve generated as described previously(17), from western blot of TF-ITD cells in plasma exposed for one hour to increasing concentrations of sorafenib. B. Standard curve generated with sorafenib N-oxide in plasma.
Figure 2
Figure 2. PIA results for patients receiving sorafenib
Plasma was isolated from whole blood samples obtained from patients receiving increasing doses of sorafenib on the clinical trial. Samples were obtained immediately prior to dosing on Days 1, 8, and 15 and 29 of each cycle. Dose levels 1, 2, and 3 correspond to total daily doses of 800, 800, and 1200 mg, respectively (see Table 1). Shown are the results from representative patients on successively higher dose levels using the PIA assay on TF-ITD cells for phosphorylated FLT3 (left) and ERK (right). For dose level 2 and 3, extra time points on Day 1 show complete silencing of FLT3 activity within 2 hours of the first dose with maintenance of this inhibition throughout the treatment cycle. Vertical lines have been inserted to indicate a repositioned gel lane.
Figure 3
Figure 3. PIA results compared with standard curve for Sorafenib
A. Plasma was collected from patients receiving sorafenib prior to dosing on day 1, 8, 15, and 29. The plasma samples underwent conventional pharmacokinetic analysis of concentrations of sorafenib and sorafenib N-oxide. In parallel, plasma from the same time points were examined in PIA assays for assessment of FLT3 and ERK inhibition potential. On the × axis the results of the pharmacokinetics are plotted for sorafenib. On the y axis, the degree of FLT3 inhibition, as assessed by PIA, is plotted as a percent of control. This data is overlaid by the standard curve for sorafenib in plasma as generated in TF-ITD cells(solid line, see Figure 1A). B. PIA results, as described in panel A, of P-ERK compared to standard curve for sorafenib inhibition of P-ERK(solid line). C. The PIA assay values for FLT3 inhibition were replotted after adjusting the “effective” sorafenib concentrations by adding the amount sorafenib N-oxide multiplied by its potency factor using the equation: Adjusted sorafenib concentration=Sorafenib + (Sorafenib N-Oxide*14.59). D. The same experimental data generated from analysis of P-Erk and corrected for sorafenib N-oxide as described in panel C.

References

    1. Larson S, Stock W. Progress in the treatment of adults with acute lymphoblastic leukemia. Curr Opin Hematol. 2008 Jul;15(4):400–407. - PubMed
    1. Tallman MS, Gilliland DG, Rowe JM. Drug therapy for acute myeloid leukemia. Blood. 2005 Aug 15;106(4):1154–1163. 2005. - PubMed
    1. Ricciardi MR, McQueen T, Chism D, Milella M, Estey E, Kaldjian E, et al. Quantitative single cell determination of ERK phosphorylation and regulation in relapsed and refractory primary acute myeloid leukemia. Leukemia. 2005 Sep;19(9):1543–1549. - PubMed
    1. Kornblau SM, Womble M, Qiu YH, Jackson CE, Chen W, Konopleva M, et al. Simultaneous activation of multiple signal transduction pathways confers poor prognosis in acute myelogenous leukemia. Blood. 2006 Oct 1;108(7):2358–2365. 2006. - PMC - PubMed
    1. Hilger RA, Scheulen ME, Strumberg D. The Ras-Raf-MEK-ERK pathway in the treatment of cancer. Onkologie. 2002 Dec;25(6):511–518. - PubMed

Publication types

MeSH terms