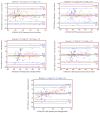
Comparison of five portable peak flow meters
- PMID: 20535364
- PMCID: PMC2882540
- DOI: 10.1590/S1807-59322010000500003
Comparison of five portable peak flow meters
Abstract
Objective: To compare the measurements of spirometric peak expiratory flow (PEF) from five different PEF meters and to determine if their values are in agreement. Inaccurate equipment may result in incorrect diagnoses of asthma and inappropriate treatments.
Methods: Sixty-eight healthy, sedentary and insufficiently active subjects, aged from 19 to 40 years, performed PEF measurements using Air Zone, Assess, Galemed, Personal Best and Vitalograph peak flow meters. The highest value recorded for each subject for each device was compared to the corresponding spirometric values using Friedman's test with Dunn's post-hoc (p<0.05), Spearman's correlation test and Bland-Altman's agreement test.
Results: The median and interquartile ranges for the spirometric values and the Air Zone, Assess, Galemed, Personal Best and Vitalograph meters were 428 (263-688 L/min), 450 (350-800 L/min), 420 (310-720 L/min), 380 (300-735 L/min), 400 (310-685 L/min) and 415 (335-610 L/min), respectively. Significant differences were found when the spirometric values were compared to those recorded by the Air Zone(R) (p<0.001) and Galemed (p<0.01) meters. There was no agreement between the spirometric values and the five PEF meters.
Conclusions: The results suggest that the values recorded from Galemed meters may underestimate the actual value, which could lead to unnecessary interventions, and that Air Zone meters overestimate spirometric values, which could obfuscate the need for intervention. These findings must be taken into account when interpreting both devices' results in younger people. These differences should also be considered when directly comparing values from different types of PEF meters.
Keywords: Airway obstruction; Asthma; Meters; Monitoring; Peak expiratory flow rate.
Figures


Similar articles
-
Comparison of four types of portable peak flow meters (Mini-Wright, Assess, Pulmo-graph and Wright Pocket meters).Respir Med. 1998 Mar;92(3):505-11. doi: 10.1016/s0954-6111(98)90299-2. Respir Med. 1998. PMID: 9692113 Clinical Trial.
-
The accuracy of portable peak flow meters.Thorax. 1992 Nov;47(11):904-9. doi: 10.1136/thx.47.11.904. Thorax. 1992. PMID: 1465746 Free PMC article.
-
Effect of altitude on spirometric parameters and the performance of peak flow meters.Thorax. 1996 Feb;51(2):175-8. doi: 10.1136/thx.51.2.175. Thorax. 1996. PMID: 8711651 Free PMC article.
-
Incorrect use of peak flow meters: are you observing your patients?J Asthma. 2014 Aug;51(6):566-72. doi: 10.3109/02770903.2014.914218. Epub 2014 May 9. J Asthma. 2014. PMID: 24720711 Review.
-
[Peak expiratory flow (PEF)].Nihon Rinsho. 2001 Oct;59(10):1955-9. Nihon Rinsho. 2001. PMID: 11676138 Review. Japanese.
Cited by
-
Relation of Changes in PEF and FEV1 During Salbutamol-Induced Bronchodilation After Methacholine Challenge Test.Pulm Med. 2025 Jul 7;2025:7675935. doi: 10.1155/pm/7675935. eCollection 2025. Pulm Med. 2025. PMID: 40661699 Free PMC article.
-
Testing the accuracy of a novel digital peak flow meter aligned with a smartphone app compared to a lab spirometer: A pilot work.Digit Health. 2021 May 21;7:20552076211005959. doi: 10.1177/20552076211005959. eCollection 2021 Jan-Dec. Digit Health. 2021. PMID: 34094586 Free PMC article.
-
Comparison of bench test results measuring the accuracy of peak flow meters.BMC Pulm Med. 2019 Apr 8;19(1):74. doi: 10.1186/s12890-019-0837-3. BMC Pulm Med. 2019. PMID: 30961573 Free PMC article.
-
The role of lung volume recruitment therapy in neuromuscular disease: a narrative review.Front Rehabil Sci. 2023 Jul 26;4:1164628. doi: 10.3389/fresc.2023.1164628. eCollection 2023. Front Rehabil Sci. 2023. PMID: 37565183 Free PMC article. Review.
-
Joint Indian Chest Society-National College of Chest Physicians (India) guidelines for spirometry.Lung India. 2019 Apr;36(Supplement):S1-S35. doi: 10.4103/lungindia.lungindia_300_18. Lung India. 2019. PMID: 31006703 Free PMC article.
References
-
- Chiaramonte LT, Prabhu SL. Comparative evaluation of five peak flow devices. J Allergy Clin Immunol. 1982;69:509–15. - PubMed
-
- Cruz AA. Peak expiratory flow. It’s better to measure! J Bras Pneumol. 2006;32:4–6. - PubMed
-
- Pistelli R, Fuso L, Muzzolon R, Bevignani G, Patalano F, Ciappi G. Comparison of the performance of two mini peak flow meters. Respiration. 1989;56:103–9. - PubMed
Publication types
MeSH terms
LinkOut - more resources
Full Text Sources
Medical

