. 2010 Jul;105(1):39-49.
doi: 10.1007/s11120-010-9562-8. Epub 2010 Jun 10.

Trophic status of Chlamydomonas reinhardtii influences the impact of iron deficiency on photosynthesis

Affiliations

Trophic status of Chlamydomonas reinhardtii influences the impact of iron deficiency on photosynthesis

Aimee M Terauchi et al. Photosynth Res. 2010 Jul.

Abstract

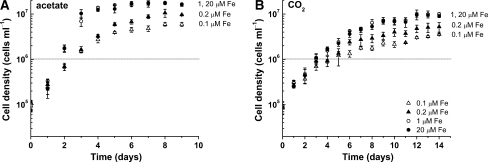
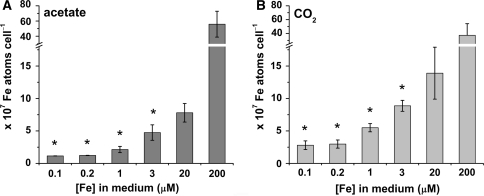
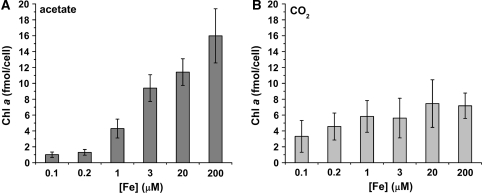
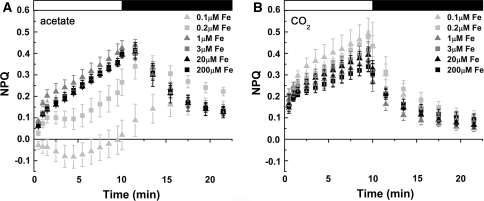
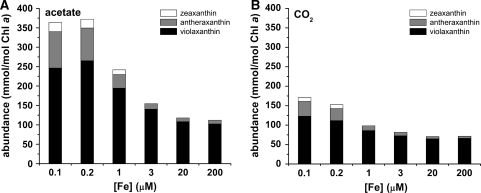
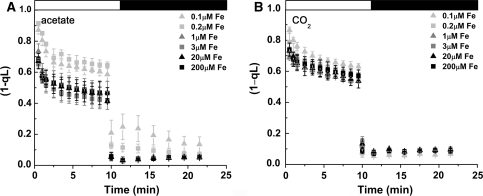
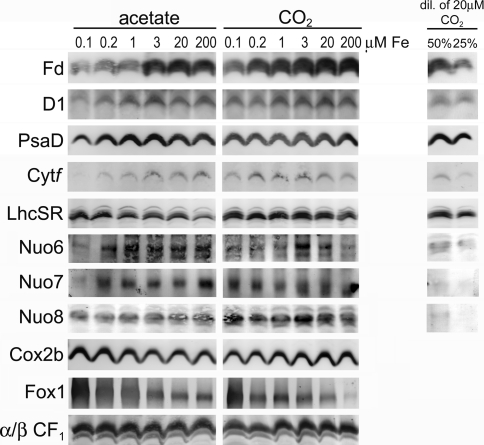
To investigate the impact of iron deficiency on bioenergetic pathways in Chlamydomonas, we compared growth rates, iron content, and photosynthetic parameters systematically in acetate versus CO(2)-grown cells. Acetate-grown cells have, predictably (2-fold) greater abundance of respiration components but also, counter-intuitively, more chlorophyll on a per cell basis. We found that phototrophic cells are less impacted by iron deficiency and this correlates with their higher iron content on a per cell basis, suggesting a greater capacity/ability for iron assimilation in this metabolic state. Phototrophic cells maintain both photosynthetic and respiratory function and their associated Fe-containing proteins in conditions where heterotrophic cells lose photosynthetic capacity and have reduced oxygen evolution activity. Maintenance of NPQ capacity might contribute to protection of the photosynthetic apparatus in iron-limited phototrophic cells. Acetate-grown iron-limited cells maintain high growth rates by suppressing photosynthesis but increasing instead respiration. These cells are also able to maintain a reduced plastoquinone pool.


Figures

Fig. 1
Fig. 1
Growth in photoheterotrophic versus phototrophic growth conditions in response to iron nutrition. Cells were grown in the presence (A) and absence (B) of acetate in various concentrations of iron. Cultures lacking acetate were bubbled with air. Various concentrations of iron represented by empty triangles (0.1-μM Fe), filled triangles (0.2-μM Fe), empty circles (1-μM Fe), and filled circles (20-μM Fe). Standard deviation based on biological triplicates. Dotted line indicates cell density at which cells were collected for analysis
Fig. 2
Fig. 2
Iron content of photoheterotrophic versus phototrophic cells in various iron concentrations. Cells were grown in the presence (A) and absence (B) of acetate in various concentrations of iron, and iron content was determined by ICP-MS. Error based on three independent experiments. Asterisk (*) denotes statistically significant differences between acetate and CO2 (one-way ANOVA, P < 0.05)
Fig. 3
Fig. 3
Chlorophyll a content of photoheterotrophic versus phototrophic cells. Cells were grown in the presence (A) and absence (B) of acetate in various concentrations of iron and chlorophyll a abundance was determined by HPLC. Standard deviation based on biological triplicates
Fig. 4
Fig. 4
Non-photochemical quenching of photoheterotrophic versus phototrophic cells in response to iron nutrition. Cells were grown in the presence (A) and absence (B) of acetate in various concentrations of iron. Cells were dark acclimated for 15 min and probed with an actinic light intensity of 217 μmol photons m−2 s−1. Various concentrations of iron represented by gray triangles (0.1-μM Fe), gray squares (0.2-μM Fe), dark gray triangles (1-μM Fe), dark gray squares (3-μM Fe), black triangles (20-μM Fe), and black squares (200-μM Fe). Standard deviation based on biological triplicates
Fig. 5
Fig. 5
Abundance of the xanthophyll cycle pigments in photoheterotrophic versus phototrophic cells in response to iron nutrition. Cells were grown in the presence (A) and absence (B) of acetate in various concentrations of iron, and the abundance of xanthophyll cycle pigments was determined by HPLC. Average of biological triplicate samples shown
Fig. 6
Fig. 6
Estimation of the redox state of the plastoquinone pool of photoheterotrophic versus phototrophic cells in response to iron nutrition. Cells were grown in the presence (A) and absence (B) of acetate in various concentrations of iron. Cells were dark acclimated for 15 min and probed with an actinic light intensity of 217 μmol photons m−2 s−1 Various concentrations of iron represented by gray triangles (0.1-μM Fe), gray squares (0.2-μM Fe), dark gray triangles (1-μM Fe), dark gray squares (3-μM Fe), black triangles (20-μM Fe), and black squares (200-μM Fe). Standard deviation based on biological triplicates
Fig. 7
Fig. 7
Abundance of photosynthetic and respiratory proteins in photoheterotrophic versus phototrophic cells in response to iron nutrition. 20 μg of total protein was separated by denaturing polyacrylamide gel electrophoresis and immunoblotted for various photosynthetic and respiratory proteins. One of three representative experiments is shown

Similar articles

Cited by

References

    1. Andaluz S, López-Millán A-F, De las Rivas J, Aro E-M, Abadía J, Abadía A. Proteomic profiles of thylakoid membranes and changes in response to iron deficiency. Photosynth Res. 2006;89:141–155. doi: 10.1007/s11120-006-9092-6. - DOI - PubMed
    1. Baker NR. Chlorophyll fluorescence: a probe of photosynthesis in vivo. Annu Rev Plant Biol. 2008;59:89–113. doi: 10.1146/annurev.arplant.59.032607.092759. - DOI - PubMed
    1. Björkman O, Demmig B. Photon yield of O2 evolution and chlorophyll fluorescence characteristics at 77 K among vascular plants of diverse origins. Planta. 1987;170:489–504. doi: 10.1007/BF00402983. - DOI - PubMed
    1. Boyd PW, Watson AJ, Law CS, Abraham ER, Trull T, Murdoch R, Bakker DCE, Bowie AR, Buesseler KO, Chang H, et al. A mesoscale phytoplankton bloom in the polar Southern Ocean stimulated by iron fertilization. Nature. 2000;407:695–702. doi: 10.1038/35037500. - DOI - PubMed
    1. Briat JF, Curie C, Gaymard F. Iron utilization and metabolism in plants. Curr Opin Plant Biol. 2007;10:276–282. doi: 10.1016/j.pbi.2007.04.003. - DOI - PubMed

Publication types

MeSH terms