

Geographic information systems and pharmacoepidemiology: using spatial cluster detection to monitor local patterns of prescription opioid abuse
- PMID: 20535759
- PMCID: PMC2946404
- DOI: 10.1002/pds.1939
Geographic information systems and pharmacoepidemiology: using spatial cluster detection to monitor local patterns of prescription opioid abuse
Abstract
Purpose: Understanding the spatial distribution of opioid abuse at the local level may facilitate public health interventions.
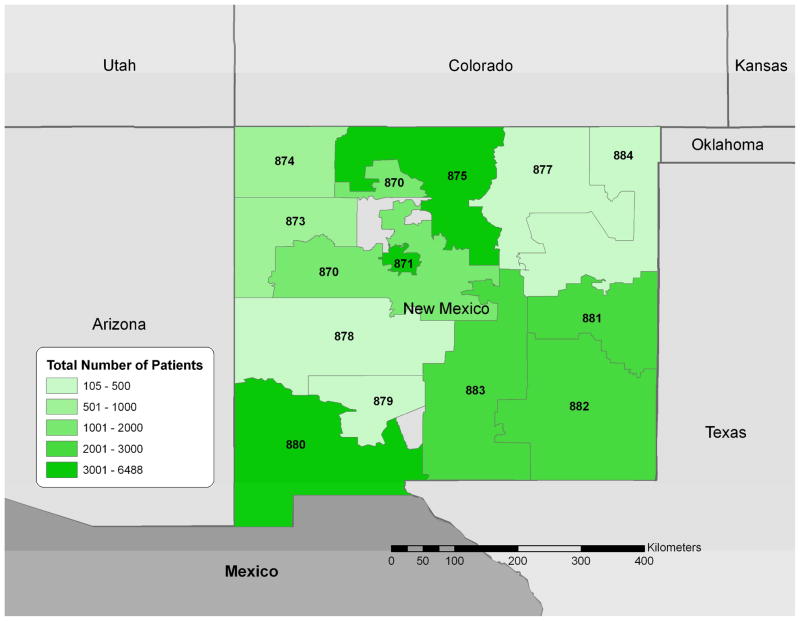
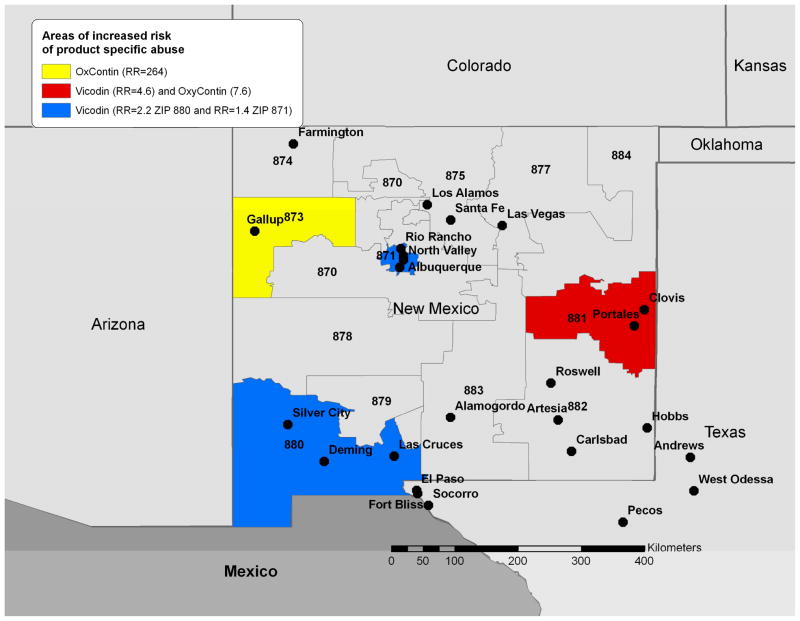
Methods: Using patient-level data from addiction treatment facilities in New Mexico from ASI-MV Connect, we applied geographic information system (GIS) in combination with a spatial scan statistic to generate risk maps of prescription opioid abuse and identify clusters of product- and compound-specific abuse. Prescribed opioid volume data was used to determine whether identified clusters are beyond geographic differences in availability.
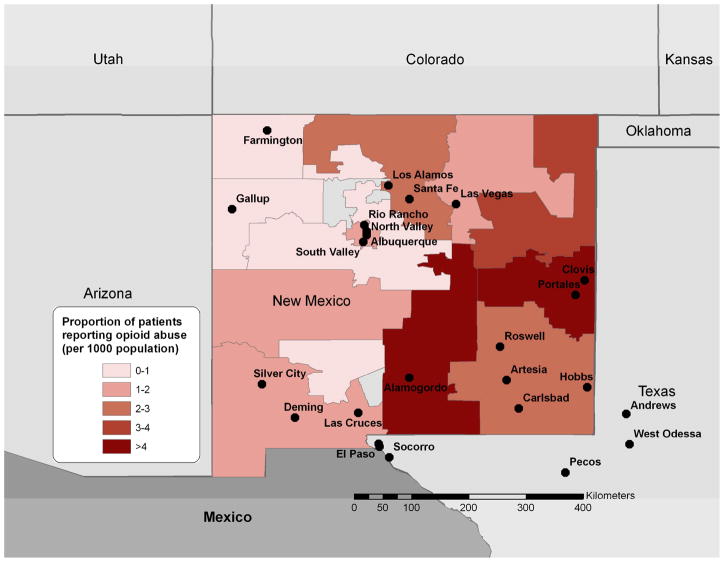
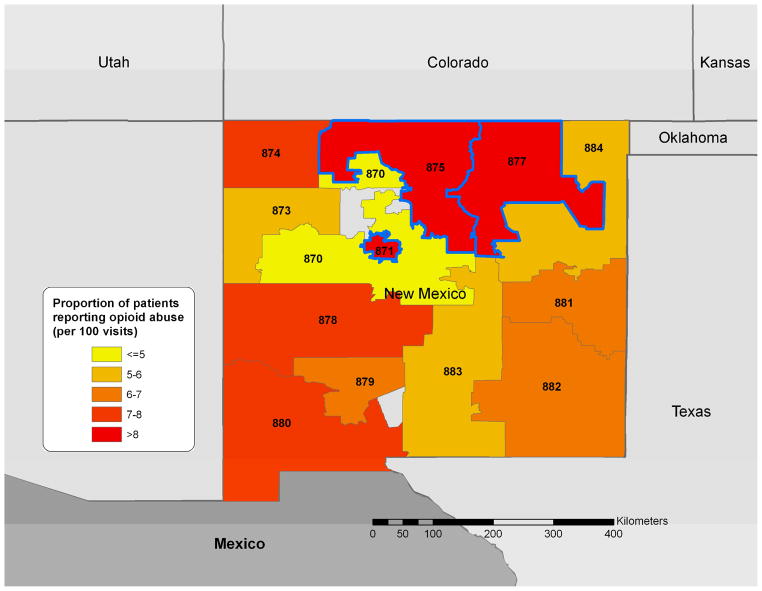
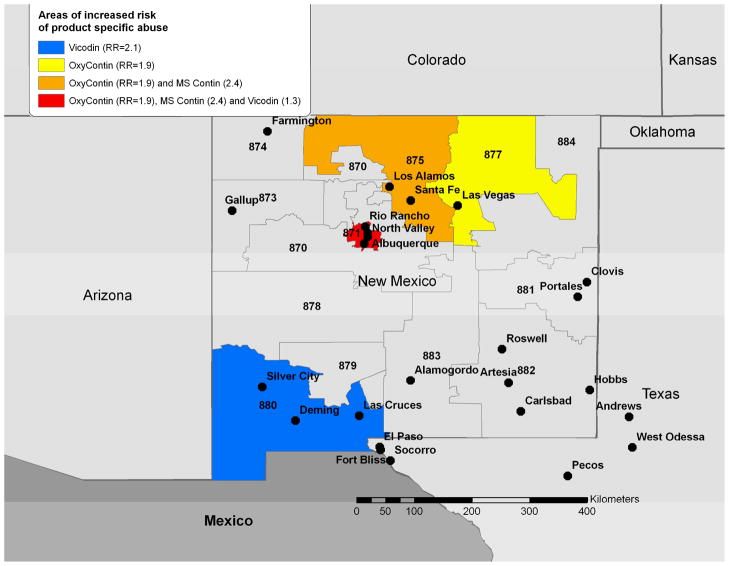
Results: Data on 24 452 patients residing in New Mexico were collected. Among those patients, 1779 (7.3%) reported abusing any prescription opioid (past 30 days). According to opioid type, 979 patients (4.0%) reported abuse of any hydrocodone, 1007 (4.1%) for any oxycodone, 108 (0.4%) for morphine, 507 (2.1%) for Vicodin or generic equivalent, 390 (1.6%) for OxyContin, and 63 (0.2%) for MS Contin or generic equivalent. Highest rates of abuse were found in the area surrounding Albuquerque with 8.6 patients indicating abuse per 100 interviewed patients. We found clustering of abuse around Albuquerque (P = 0.001; Relative Risk = 1.35, and a radius of 146 km). At the compound level, we found that drug availability was partly responsible for clustering of prescription opioid abuse. After accounting for drug availability, we identified a second foci of Vicodin abuse in the southern rural portion of the state near Las Cruces, NM and El Paso, Texas and bordering Mexico (RR = 2.1; P = 0.001).
Conclusions: A better understanding of local risk distribution may have implications for response strategies to future introductions of prescription opioids.
Figures
References
-
- Dasgupta N, Kramer ED, Zalman MA, et al. Association between non-medical and prescriptive usage of opioids. Drug Alcohol Depend. 2006;82:135–42. - PubMed
-
- Hopfer CJ, Mikulich SK, Crowley TJ. Heroin use among adolescents in treatment for substance use disorders. J Am Acad Child Adolesc Psychiatry. 2000;39:1316–23. - PubMed
-
- Paulozzi LJ, Budnitz DS, Xi Y. Increasing deaths from opioid analgesics in the United States. Pharmacoepidemiol Drug Saf. 2006;15:618–27. - PubMed
-
- Butler SF, Budman SH, Licari A, et al. National addictions vigilance intervention and prevention program (NAVIPPRO): a real-time, product-specific, public health surveillance system for monitoring prescription drug abuse. Pharmacoepidemiol Drug Saf. 2008;17:1142–54. - PubMed
Publication types
MeSH terms
Substances
Grants and funding
LinkOut - more resources
Full Text Sources
Medical
Miscellaneous
