. 2010 Aug;64(2):554-66.
doi: 10.1002/mrm.22365.

Reconstruction of the orientation distribution function in single- and multiple-shell q-ball imaging within constant solid angle

Affiliations

Reconstruction of the orientation distribution function in single- and multiple-shell q-ball imaging within constant solid angle

Iman Aganj et al. Magn Reson Med. 2010 Aug.

Abstract

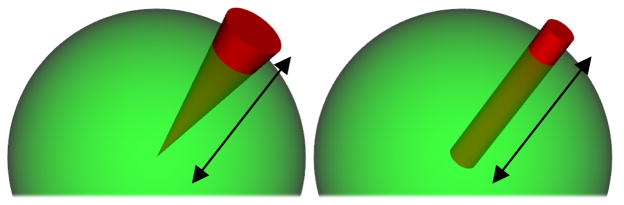
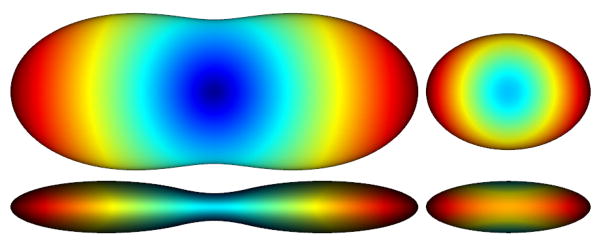
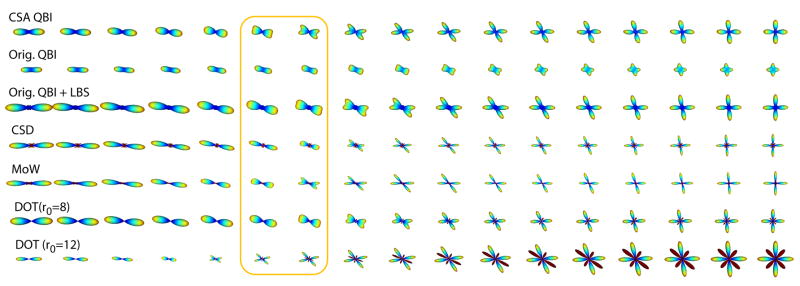
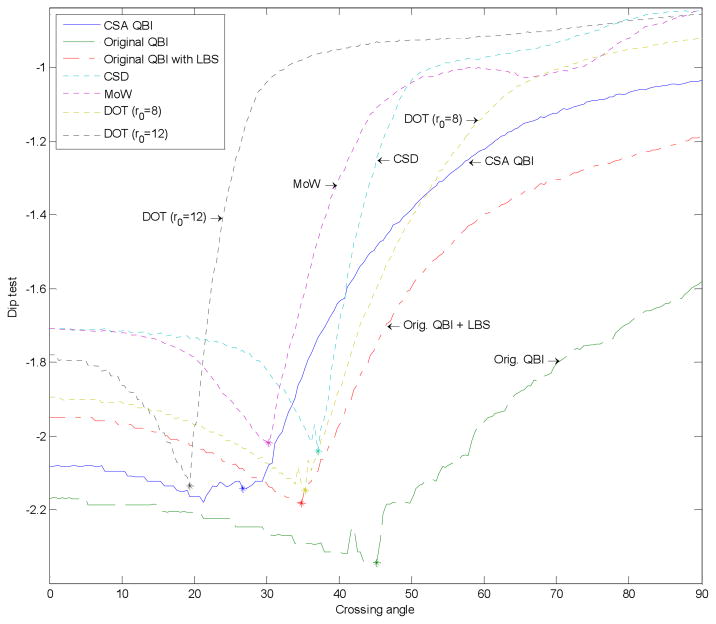
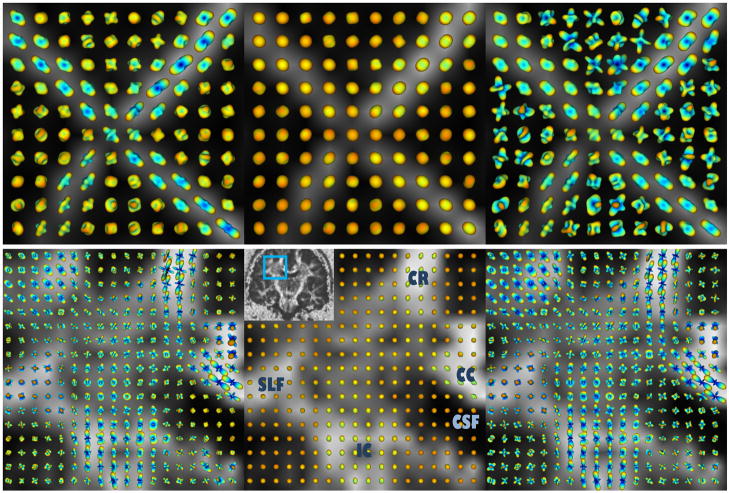
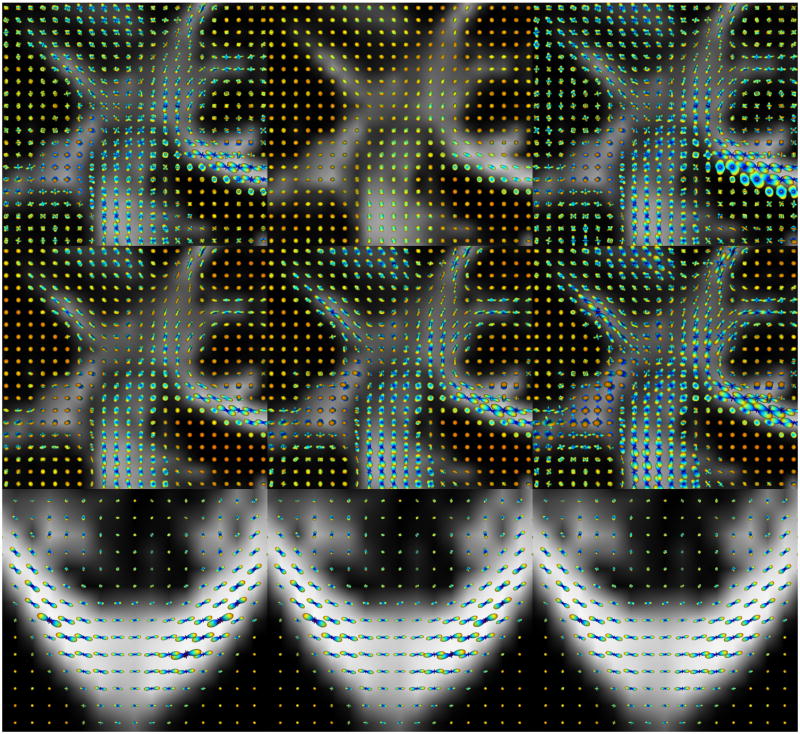
q-Ball imaging is a high-angular-resolution diffusion imaging technique that has been proven very successful in resolving multiple intravoxel fiber orientations in MR images. The standard computation of the orientation distribution function (the probability of diffusion in a given direction) from q-ball data uses linear radial projection, neglecting the change in the volume element along each direction. This results in spherical distributions that are different from the true orientation distribution functions. For instance, they are neither normalized nor as sharp as expected and generally require postprocessing, such as artificial sharpening. In this paper, a new technique is proposed that, by considering the solid angle factor, uses the mathematically correct definition of the orientation distribution function and results in a dimensionless and normalized orientation distribution function expression. Our model is flexible enough so that orientation distribution functions can be estimated either from single q-shell datasets or by exploiting the greater information available from multiple q-shell acquisitions. We show that the latter can be achieved by using a more accurate multiexponential model for the diffusion signal. The improved performance of the proposed method is demonstrated on artificial examples and high-angular-resolution diffusion imaging data acquired on a 7-T magnet.


Figures

Fig. 1
Fig. 1
Radial integration of the PDF, (left) in a cone of constant solid angle (i.e., the factor r2 is considered), and (right) by linear projection (i.e., without the factor r2 as done in the original QBI).
Fig. 2
Fig. 2
DTI example of ODF reconstruction (with {10, 5, 1} as the diagonal entries of the tensor), shown from two view angles, (left) considering the factor r2 (CSA) (right) without the factor r2 and after normalization. Note how less sharp the latter is and how incompletely it represents the true structure of the ODF.
Fig. 3
Fig. 3
Behavior of (left) ln(−ln E) and (right) the absolute value of its derivative with respect to E. Note how unstable they are for E close to 0 or 1.
Fig. 4
Fig. 4
The regularization function used for the diffusion signal to avoid the unstable regions (blue curve). The truncating margins are exaggerated for better visualization.
Fig. 5
Fig. 5
Experimental results on synthetic data with fiber crossing, using: Proposed CSA QBI, original QBI after normalization, original QBI with Laplace-Beltrami sharpening (LBS), Constrained Spherical Deconvolution (CSD), Mixture of Wisharts (MoW) with manually optimized parameters, and Diffusion Orientation Transform (DOT) for two radii. The two columns in the box correspond to the crossing angles of 28.1° and 33.8°. Dark red represents negative values.
Fig. 6
Fig. 6
Results of the dip test (a measure of multimodality) using the same distributions as shown in Fig. 5. The asterisk (*) on each curve indicates the minimum angle where the bimodality is detected. The y-axis is plotted on a logarithmic scale.
Fig. 7
Fig. 7
Reconstructed ODFs from (top) rat spinal cord phantom and (bottom) human brain, shown on the FA map, using: (left) CSA QBI, (middle) original QBI after normalization, and (right) original QBI with LBS.
Fig. 8
Fig. 8
(Top row): Reconstructed ODFs from 7T human brain data shown on the FA map, using: (left) CSA QBI, (middle) original QBI after normalization, and (right) original QBI with LBS. (Middle row): Results of DOT for different radii, ascending from left to right. (Bottom row): ODFs reconstructed using regularization parameters of (left) 0.001, (middle) 0.01, and (right) without regularization using the L1 error norm. A singly refocused 2D single shot spin echo EPI sequence was used. Image parameters were: FOV: 192×192 mm2 (matrix: 196×96) to yield a spatial resolution of 2×2×2 mm3, TR/TE 4800/57 msec., acceleration factor (GRAPPA) of 2 and 6/8 partial Fourier were used along the phase encode direction. Diffusion-weighted images were acquired at three b-values of 1000, 2000 and 3000 s/mm2 with 256 directions, along with 31 baseline images. EPI echo spacing was 0.57 msec. with a bandwidth of 2895 Hz/Px.
Fig. 9
Fig. 9
Results of the ODF reconstruction on synthetic data. Note how the bi-exponential model correctly resolves the maxima of the ODF from low b-values. Dark red represents negative values. These values do not appear often in general, nonetheless, a possible formal approach to handle them can be found at (30).
Fig. 10
Fig. 10
Reconstructed ODFs from the real brain data, shown on the FA map. The bi-exponential model ODFs (top, left) have been scaled down 1.5 times for better comparison. All the ODFs except those in (top, right) are CSA ODFs. Note how the bi-exponential model for diffusion improves the resolution of fiber crossings, compared to the mono-exponential (constant ADC) model. An anesthetized Macaca mulatta monkey was scanned using a 7T MR scanner (Siemens) equipped with a head gradient coil (80mT/m G-maximum, 200mT/m/ms) with a diffusion weighted spin-echo EPI sequence. Diffusion images were acquired (twice during the same session, and then averaged) over 100 directions uniformly distributed on the sphere. We used three b-values of 1000, 2000, and 3000 s/mm2, TR/TE of 4600/65 ms, and a voxel size of 1×1×1 mm3.

Similar articles

Cited by

References

    1. Wedeen VJ, Hagmann P, Tseng WI, Reese TG, Weisskoff RM. Mapping complex tissue architecture with diffusion spectrum magnetic resonance imaging. Magnetic Resonance in Medicine. 2005;54(6):1377–1386. - PubMed
    1. Tuch DS, Reese TG, Wiegell MR, Makris N, Belliveau JW, Wedeen VJ. High angular resolution diffusion imaging reveals intravoxel white matter fiber heterogeneity. Magnetic Resonance in Medicine. 2002;48(4):577–582. - PubMed
    1. Tuch DS. Q-ball imaging. Magnetic Resonance in Medicine. 2004;52(6):1358–1372. - PubMed
    1. Funk P. Über eine geometrische Anwendung der Abelschen Integralgleichung. Mathematische Annalen. 1916;77:129–135.
    1. Anderson AW. Measurement of fiber orientation distributions using high angular resolution diffusion imaging. Magnetic Resonance in Medicine. 2005;54(5):1194–1206. - PubMed

Publication types

MeSH terms