Biophysical characterization of iron in mitochondria isolated from respiring and fermenting yeast
- PMID: 20536189
- PMCID: PMC2898134
- DOI: 10.1021/bi100558z
Biophysical characterization of iron in mitochondria isolated from respiring and fermenting yeast
Abstract
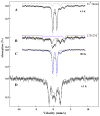
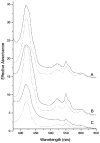
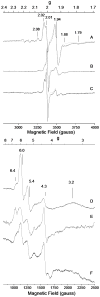
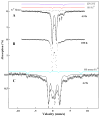
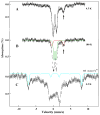
The distributions of Fe in mitochondria isolated from respiring, respiro-fermenting, and fermenting yeast cells were determined with an integrative biophysical approach involving Mossbauer and electronic absorption spectroscopies, electron paramagnetic resonance, and inductively coupled plasma emission mass spectrometry. Approximately 40% of the Fe in mitochondria from respiring cells was present in respiration-related proteins. The concentration and distribution of Fe in respiro-fermenting mitochondria, where both respiration and fermentation occur concurrently, were similar to those of respiring mitochondria. The concentration of Fe in fermenting mitochondria was also similar, but the distribution differed dramatically. Here, levels of respiration-related Fe-containing proteins were diminished approximately 3-fold, while non-heme HS Fe(II) species, non-heme mononuclear HS Fe(III), and Fe(III) nanoparticles dominated. These changes were rationalized by a model in which the pool of non-heme HS Fe(II) ions serves as feedstock for Fe-S cluster and heme biosynthesis. The integrative approach enabled us to estimate the concentration of respiration-related proteins.
Figures



Similar articles
-
Mössbauer and LC-ICP-MS investigation of iron trafficking between vacuoles and mitochondria in vma2ΔSaccharomyces cerevisiae.J Biol Chem. 2021 Jan-Jun;296:100141. doi: 10.1074/jbc.RA120.015907. Epub 2020 Dec 6. J Biol Chem. 2021. PMID: 33268384 Free PMC article.
-
Biophysical investigation of the ironome of human jurkat cells and mitochondria.Biochemistry. 2012 Jul 3;51(26):5276-84. doi: 10.1021/bi300382d. Epub 2012 Jun 22. Biochemistry. 2012. PMID: 22726227 Free PMC article.
-
Recovery of mrs3Δmrs4Δ Saccharomyces cerevisiae Cells under Iron-Sufficient Conditions and the Role of Fe580.Biochemistry. 2018 Feb 6;57(5):672-683. doi: 10.1021/acs.biochem.7b01034. Epub 2018 Jan 4. Biochemistry. 2018. PMID: 29228768 Free PMC article.
-
Biophysical probes of iron metabolism in cells and organelles.Curr Opin Chem Biol. 2011 Apr;15(2):342-6. doi: 10.1016/j.cbpa.2011.01.007. Epub 2011 Feb 1. Curr Opin Chem Biol. 2011. PMID: 21282072 Free PMC article. Review.
-
The role of mitochondria in cellular iron-sulfur protein biogenesis and iron metabolism.Biochim Biophys Acta. 2012 Sep;1823(9):1491-508. doi: 10.1016/j.bbamcr.2012.05.009. Epub 2012 May 15. Biochim Biophys Acta. 2012. PMID: 22609301 Review.
Cited by
-
Contribution of Mössbauer spectroscopy to the investigation of Fe/S biogenesis.J Biol Inorg Chem. 2018 Jun;23(4):635-644. doi: 10.1007/s00775-018-1534-z. Epub 2018 Jan 19. J Biol Inorg Chem. 2018. PMID: 29350298 Free PMC article. Review.
-
Mössbauer and LC-ICP-MS investigation of iron trafficking between vacuoles and mitochondria in vma2ΔSaccharomyces cerevisiae.J Biol Chem. 2021 Jan-Jun;296:100141. doi: 10.1074/jbc.RA120.015907. Epub 2020 Dec 6. J Biol Chem. 2021. PMID: 33268384 Free PMC article.
-
HRG-9 homologues regulate haem trafficking from haem-enriched compartments.Nature. 2022 Oct;610(7933):768-774. doi: 10.1038/s41586-022-05347-z. Epub 2022 Oct 19. Nature. 2022. PMID: 36261532 Free PMC article.
-
Yeast Mitochondria Import Aqueous FeII and, When Activated for Iron-Sulfur Cluster Assembly, Export or Release Low-Molecular-Mass Iron and Also Export Iron That Incorporates into Cytosolic Proteins.J Am Chem Soc. 2023 Jun 28;145(25):13556-13569. doi: 10.1021/jacs.2c13439. Epub 2023 Jun 20. J Am Chem Soc. 2023. PMID: 37339084 Free PMC article.
-
Binding of yeast and human cytochrome c to cardiolipin nanodiscs at physiological ionic strength.J Inorg Biochem. 2024 Nov;260:112699. doi: 10.1016/j.jinorgbio.2024.112699. Epub 2024 Aug 13. J Inorg Biochem. 2024. PMID: 39181020
References
-
- Hudder BN, Morales JG, Stubna A, Münck E, Hendrich MP, Lindahl PA. Electron paramagnetic resonance and Mössbauer spectroscopy of intact mitochondria from respiring Saccharomyces cerevisiae. Journal of Biological Inorganic Chemistry. 2007;12:1029–1053. - PubMed
-
- Lindahl PA, Morales JG, Miao R, Holmes-Hampton G. Chapter 15 Isolation of Saccharomyces cerevisiae mitochondria for Mössbauer, EPR, and electronic absorption spectroscopic analyses. Methods Enzymol. 2009;456:267–285. - PubMed
-
- Lill R, Muhlenhoff U. Maturation of iron-sulfur proteins in eukaryotes: Mechanisms, connected processes, and diseases. Annu Rev Biochem. 2008;77:669–700. - PubMed
-
- Beinert H. Spectroscopy of succinate dehydrogenases, a historical perspective. Biochimica Et Biophysica Acta-Bioenergetics. 2002;1553:7–22. - PubMed
-
- Hunte C, Koepke J, Lange C, Rossmanith T, Michel H. Structure at 2.3 angstrom resolution of the cytochrome bc(1) complex from the yeast Saccharomyces cerevisiae co-crystallized with an antibody Fv fragment. Structure. 2000;8:669–684. - PubMed
Publication types
MeSH terms
Substances
Grants and funding
LinkOut - more resources
Full Text Sources
Medical
Molecular Biology Databases
Miscellaneous

