. 2011 Mar;20(3):427-39.
doi: 10.1089/scd.2010.0082. Epub 2010 Oct 17.

Deleterious effects of freezing on osteogenic differentiation of human adipose-derived stromal cells in vitro and in vivo

Affiliations

Deleterious effects of freezing on osteogenic differentiation of human adipose-derived stromal cells in vitro and in vivo

Aaron W James et al. Stem Cells Dev. 2011 Mar.

Abstract

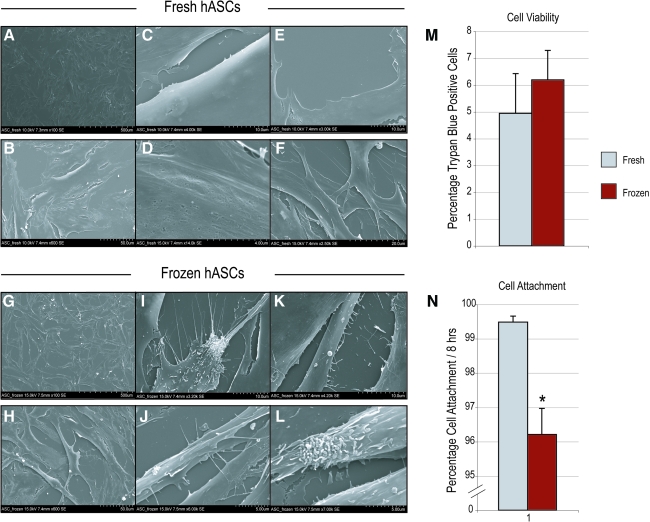
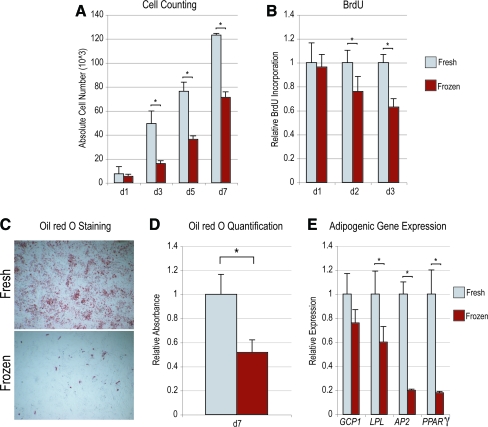
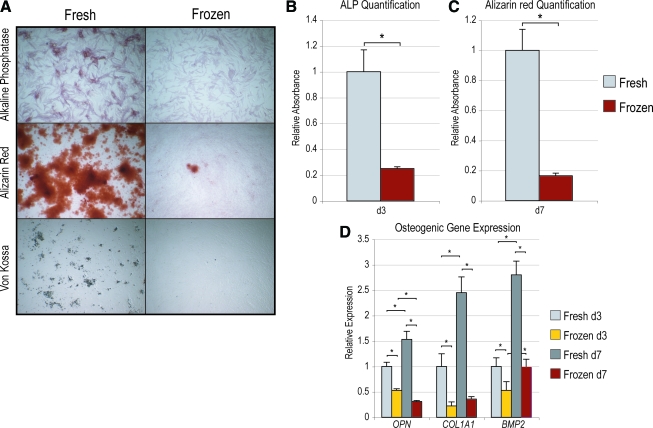
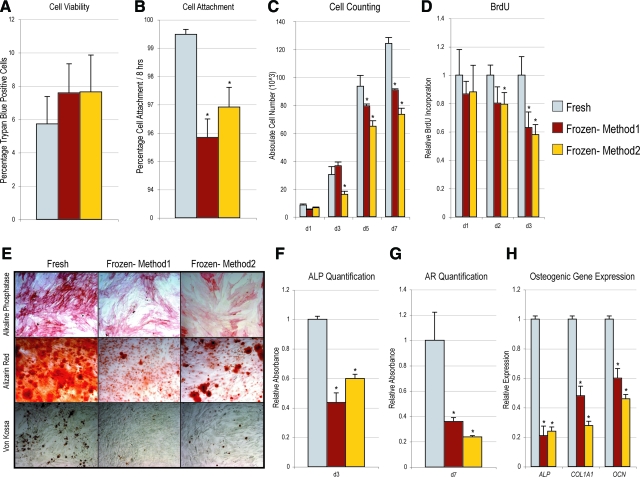
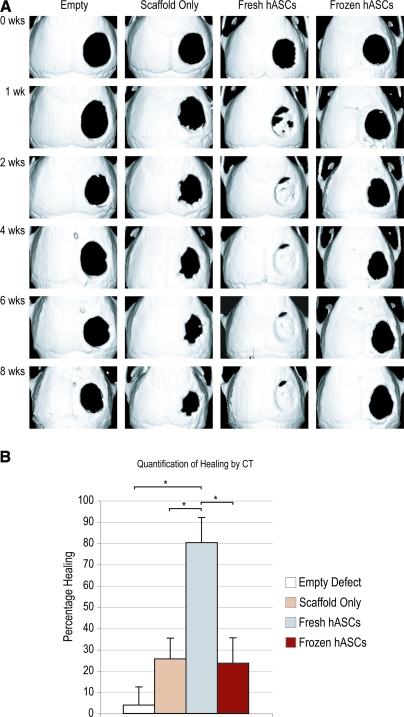
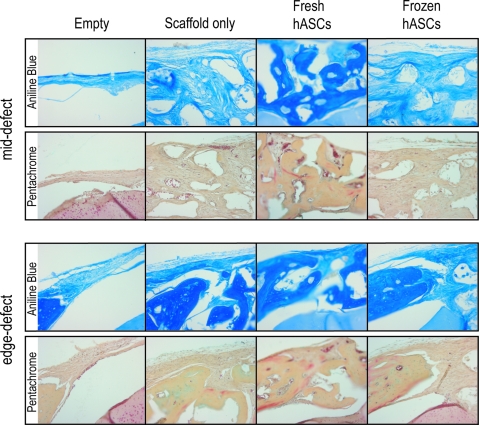
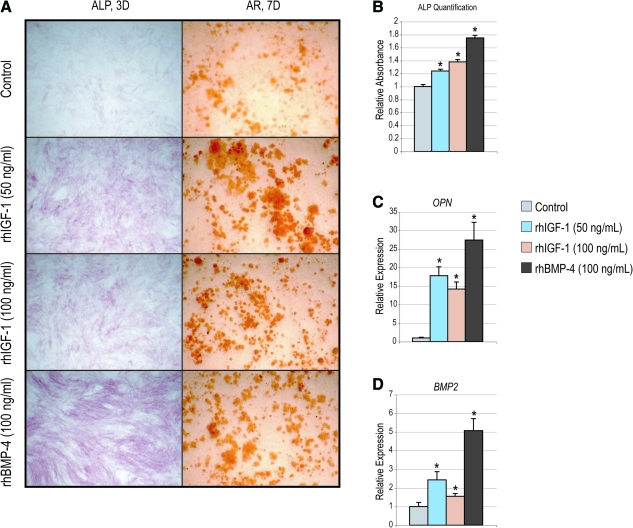
Human adipose-derived stromal cells (hASCs) represent a multipotent stromal cell type with a proven capacity to undergo osteogenic differentiation. Many hurdles exist, however, between current knowledge of hASC osteogenesis and their potential future use in skeletal tissue regeneration. The impact of frozen storage on hASC osteogenic differentiation, for example, has not been studied in detail. To examine the effects of frozen storage, hASCs were harvested from lipoaspirate and either maintained in standard culture conditions or frozen for 2 weeks under standard conditions (90% fetal bovine serum, 10% dimethyl sulfoxide). Next, in vitro parameters of cell morphology (surface electron microscopy [EM]), cell viability and growth (trypan blue; bromodeoxyuridine incorporation), osteogenic differentiation (alkaline phosphatase, alizarin red, and quantitative real-time (RT)-polymerase chain reaction), and adipogenic differentiation (Oil red O staining and quantitative RT-polymerase chain reaction) were performed. Finally, in vivo bone formation was assessed using a critical-sized cranial defect in athymic mice, utilizing a hydroxyapatite (HA)-poly(lactic-co-glycolic acid) scaffold for ASC delivery. Healing was assessed by serial microcomputed tomography scans and histology. Freshly derived ASCs differed significantly from freeze-thaw ASCs in all markers examined. Surface EM showed distinct differences in cellular morphology. Proliferation, and osteogenic and adipogenic differentiation were all significantly hampered by the freeze-thaw process in vitro (*P < 0.01). In vivo, near complete healing was observed among calvarial defects engrafted with fresh hASCs. This was in comparison to groups engrafted with freeze-thaw hASCs that showed little healing (*P < 0.01). Finally, recombinant insulin-like growth factor 1 or recombinant bone morphogenetic protein 4 was observed to increase or rescue in vitro osteogenic differentiation among frozen hASCs (*P < 0.01). The freezing of ASCs for storage significantly impacts their biology, both in vitro and in vivo. The ability of ASCs to successfully undergo osteogenic differentiation after freeze-thaw is substantively muted, both in vitro and in vivo. The use of recombinant proteins, however, may be used to mitigate the deleterious effects of the freeze-thaw process.


Figures

FIG. 1.
FIG. 1.
(A–L) Surface electron microscopy of fresh (above, A–F) and freeze–thaw (below, G–L) human adipose-derived stromal cells (hASCs). Surface features of fresh versus frozen hASCs at various magnifications. In the lower left of each image, the kV, and magnification (standard error) is presented accompanied by scale bar on lower right. At the lowest magnification, 100 × (A, G), fresh and frozen hASCs appear similar. At medium magnification, 600 × , fresh hASCs appear broad and flat (B) compared with freeze–thaw hASCs, which appear more stellate (H). At higher magnification, further differences are apparent between fresh hASCs (C–F) and frozen hASCs (I–L). (M) Cell viability among fresh compared with frozen hASCs, represented by percentage Trypan blue staining. (N) Percentage cell attachment among fresh as compared with frozen hASCs, after 8 h under standard culture conditions. *P < 0.05. Color images available online at www.liebertonline.com/scd.
FIG. 2.
FIG. 2.
(A, B) Cellular proliferation among hASCs subjected to a 2-week freeze–thaw (frozen) as compared with control (fresh). (A) Cell counting assays performed over 7 days in the standard growth medium (Dulbecco's modified Eagle's medium and 10% fetal bovine serum) by trypsinization and hemocytometer analysis. (B) Bromodeoxyuridine (BrdU) incorporation assays were performed over 3 days in the standard growth medium by enzyme-linked immunosorbent assay. Labeling reagent was applied for 8 h in culture. n = 3 for cell counting, n = 6 for BrdU. Statistical significances were calculated between fresh and frozen hASCs at individual days using the Student's t-test. *P < 0.01. (C–E) Adipogenic differentiation among hASCs subjected to a 2-week freeze–thaw (frozen) as compared with control (fresh). (C) Oil red O staining, performed at 7 days of differentiation. Representative wells are presented at 4 × magnification. (D) After Oil red O staining, quantification was performed by leaching and measurement of absorbance, *P = 0.0076. (E) Adipocyte gene expression was assayed by quantitative real time (RT)-polymerase chain reaction (qRT-PCR) at 7 days of differentiation. From left to right: GCP1, LPL, AP2, and PPAR-γ. From left to right: *P = 0.11, 0.039, 0.0002, and 0.0021, respectively. n = 3 for all assays. Statistical significances were calculated between fresh and frozen hASCs using the Student's t-test. *P < 0.05. Color images available online at www.liebertonline.com/scd.
FIG. 3.
FIG. 3.
Osteogenic differentiation among hASCs subjected to a 2-week freeze–thaw (frozen) as compared with control (fresh). (A, top) Alkaline phosphatase (ALP) staining, performed at 3 days of differentiation. Representative wells are presented at 4 × magnification. (A, middle) Alizarin red (AR) staining, performed at 7 days of differentiation, 4 × magnification. (A, bottom) Von Kossa staining, performed at 7 days of differentiation, 4 × magnification. (B) Relative ALP quantification was performed at 3 days, normalized to protein content, *P = 0.0016. (C) Relative AR staining was quantified at 7 days of differentiation, *P = 0.0005. (D) Osteogenic gene expression was assayed by qRT-PCR at 3 and 7 days of differentiation. From left to right: OPN, COL1A1, and BMP2. From left to right: F = 105.54, 74.64, and 78.99, respectively; *P = 0.0001 for all. n = 3 for all assays. Statistical significances were calculated between fresh and frozen hASCs using a 2-factor analysis of variance (ANOVA) (cell group and time point) and a post-hoc Student's t-test. *P < 0.05. Color images available online at www.liebertonline.com/scd.
FIG. 4.
FIG. 4.
Comparison of freezing methods on in vitro cellular parameters. ASCs were either used freshly after isolation, or frozen for 2 weeks under 2 conditions: either (1) frozen at −80°C overnight using a Styrofoam container followed by storage in liquid nitrogen, or (2) using a Mr. Frosty freezing device to approximate a −1°C/min decline in temperature. (A) Cell viability as measured by percentage Trypan blue-positive cells directly after freeze–thaw in comparison to freshly derived hASCs. (B) Cell attachment as measured by percentage cell attachment directly after freeze–thaw in comparison to fresh ASCs. (C, D) Comparison of cell proliferation, measured by both cell counting and BrdU incorporation assays. (E, H) Osteogenic differentiation among hASCs subjected to a 2-week freeze–thaw under either freezing condition (Method 1 or 2) as compared with control (Fresh). (E, top) ALP staining, performed at 3 days of differentiation. Representative wells are presented at 10 × magnification. (E, middle) AR staining, performed at 7 days of differentiation, 10 × magnification. (E, bottom) Von Kossa staining, performed at 7 days of differentiation, 10 × magnification. (F) Relative ALP quantification was performed at 3 days, normalized to protein content. (G) Relative AR staining was quantified at 7 days of differentiation. (H) Relative osteogenic gene expression after 3 days of differentiation normalized to control groups (Fresh). Statistical significance was calculated using a 1-factor ANOVA (A, B, and F, G) or 2-factor ANOVA (C, D, and H) with *P < 0.05, followed by a post-hoc Student's t-test in comparison in control groups. Color images available online at www.liebertonline.com/scd.
FIG. 5.
FIG. 5.
Calvarial defects as shown by microcomputed tomography (CT) analysis. Four millimeters calvarial defects were allowed to heal for up to 8 weeks; serial microCTs were performed. (A) Four treatment groups included those defects left empty (empty, far left), those treated with a scaffold but without hASCs (scaffold only, middle left), those treated with a fresh hASC-engrafted scaffold (fresh hASCs, middle right), and finally those treated with a frozen hASC-engrafted scaffold (frozen hASCs, far right). (B) Quantification of healing by microCT. Four millimeters calvarial defects were allowed to heal for 4 weeks before analysis of percentage healing by microCT, using Adobe Photoshop. Statistical significances were calculated between fresh and frozen hASCs using a 1-factor ANOVA (treatment group) and a post-hoc Student's t-test. *P < 0.05. Color images available online at www.liebertonline.com/scd.
FIG. 6.
FIG. 6.
Histology of calvarial defects. Four millimeters calvarial defects were allowed to heal for 4 weeks before histological analysis by aniline blue and pentachrome. Four treatment groups included those defects left empty (empty), those treated with a scaffold but without hASCs (scaffold only), those treated with a fresh hASC-engrafted scaffold (fresh hASCs), and, finally, those treated with a frozen hASC-engrafted scaffold (frozen hASCs). Pictures were taken of the mid-point and edge of the defect site. In aniline blue stains, bone appears dark blue. In contrast, in pentachrome stain, bone appears yellow. Color images available online at www.liebertonline.com/scd.
FIG. 7.
FIG. 7.
Rescue of frozen hASC osteogenic differentiation. (A, left) ALP staining after 3 days of differentiation among frozen hASCs with or without recombinant human insulin-like growth factor (rhIGF-1) or recombinant human bone morphogenetic protein 4 (rhBMP-4). (A, right) AR staining after 7 days of differentiation among frozen hASCs with or without rhIGF-1 or rhBMP-4. (B) ALP quantification, normalized to total protein content at 3 days. (C, D) OPN and BMP2 expression at 3 days differentiation by qRT-PCR. n = 3 for all assays. Statistical significances were calculated between control and treated hASCs using a 1-factor ANOVA (treatment group) and a post-hoc Student's t-test. *P < 0.05. Color images available online at www.liebertonline.com/scd.

Similar articles

Cited by

References

    1. Kwan MD. Slater BJ. Wan DC. Longaker MT. Cell-based therapies for skeletal regenerative medicine. Hum Mol Genet. 2008;17:R93–R98. - PubMed
    1. Zuk PA. Zhu M. Ashjian P. De Ugarte DA. Huang JI. Mizuno H. Alfonso ZC. Fraser JK. Benhaim P. Hedrick MH. Human adipose tissue is a source of multipotent stem cells. Mol Biol Cell. 2002;13:4279–4295. - PMC - PubMed
    1. Zuk PA. Zhu M. Mizuno H. Huang J. Futrell JW. Katz AJ. Benhaim P. Lorenz HP. Hedrick MH. Multilineage cells from human adipose tissue: implications for cell-based therapies. Tissue Eng. 2001;7:211–228. - PubMed
    1. Xu Y. Hammerick KE. James AW. Carre AL. Leucht P. Giaccia AJ. Longaker MT. Inhibition of histone deacetylase activity in reduced oxygen environment enhances the osteogenesis of mouse adipose-derived stromal cells. Tissue Eng Part A. 2009;15:3697–3707. - PMC - PubMed
    1. Wan DC. Pomerantz JH. Brunet LJ. Kim JB. Chou YF. Wu BM. Harland R. Blau HM. Longaker MT. Noggin suppression enhances in vitro osteogenesis and accelerates in vivo bone formation. J Biol Chem. 2007;282:26450–26459. - PubMed

Publication types

MeSH terms

Substances

LinkOut - more resources