

Bioaccumulation syndrome: identifying factors that make some stream food webs prone to elevated mercury bioaccumulation
- PMID: 20536817
- PMCID: PMC2977981
- DOI: 10.1111/j.1749-6632.2010.05456.x
Bioaccumulation syndrome: identifying factors that make some stream food webs prone to elevated mercury bioaccumulation
Abstract
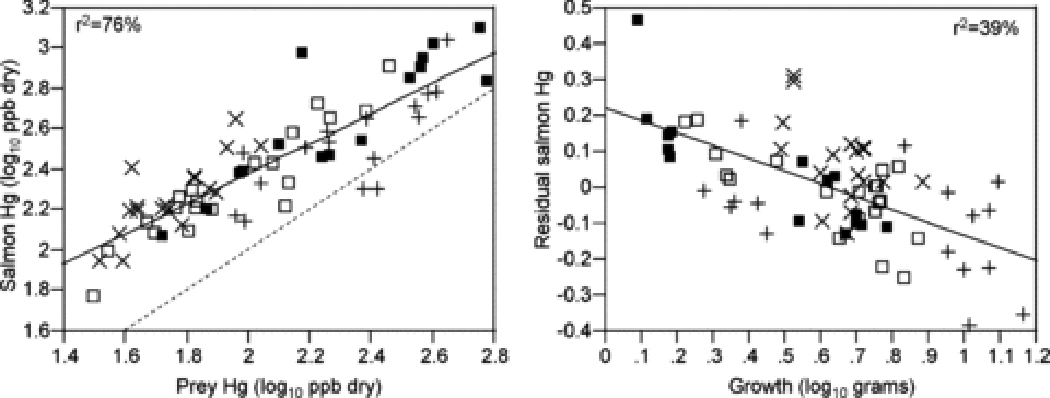
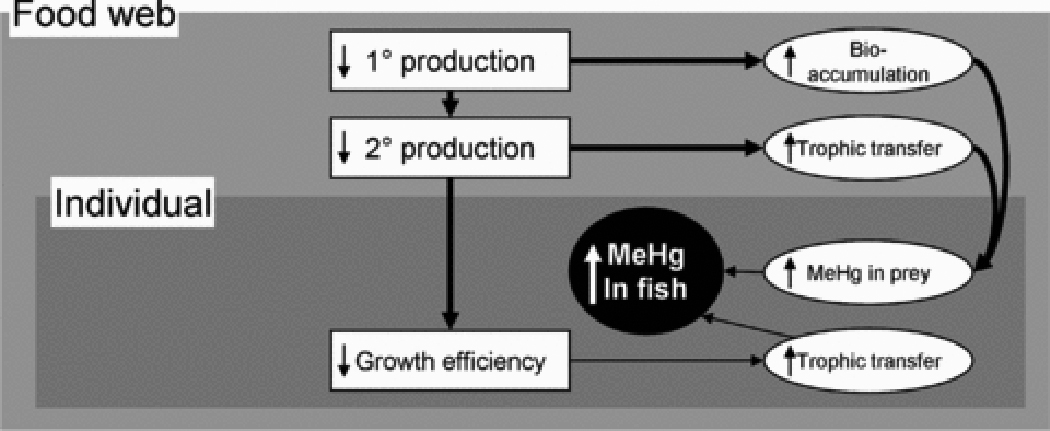
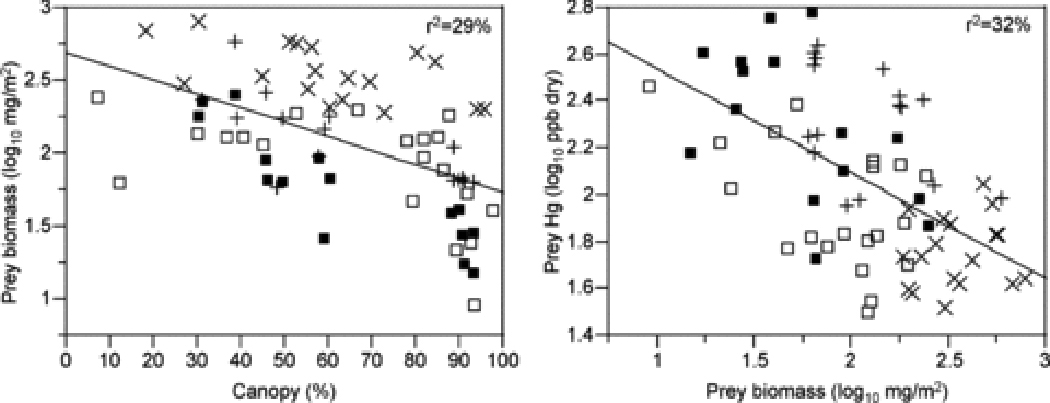
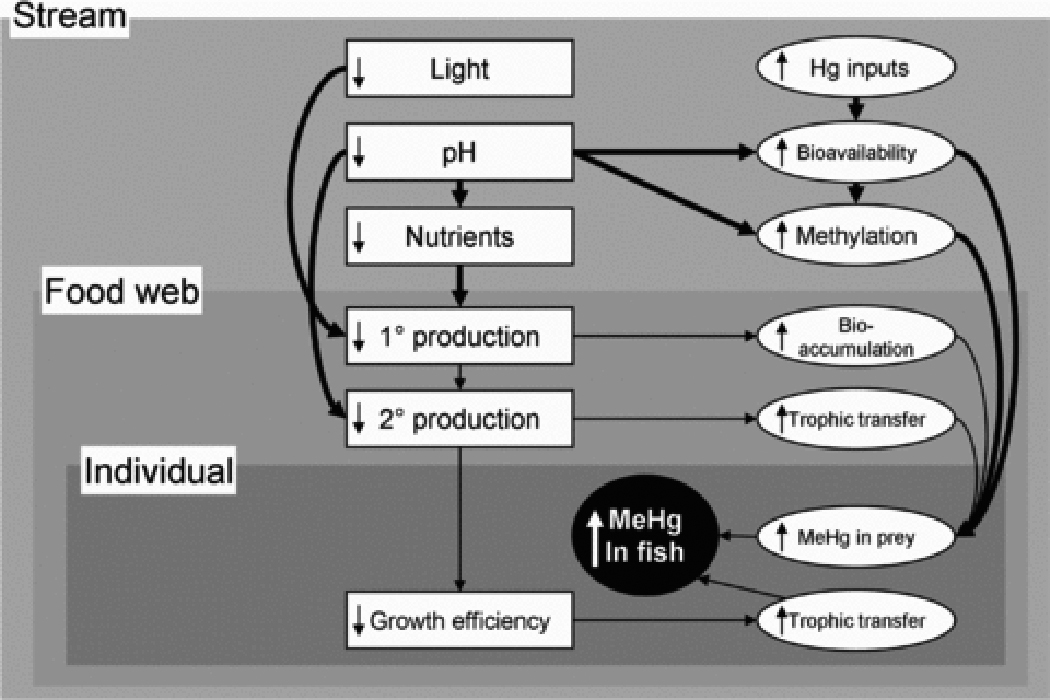
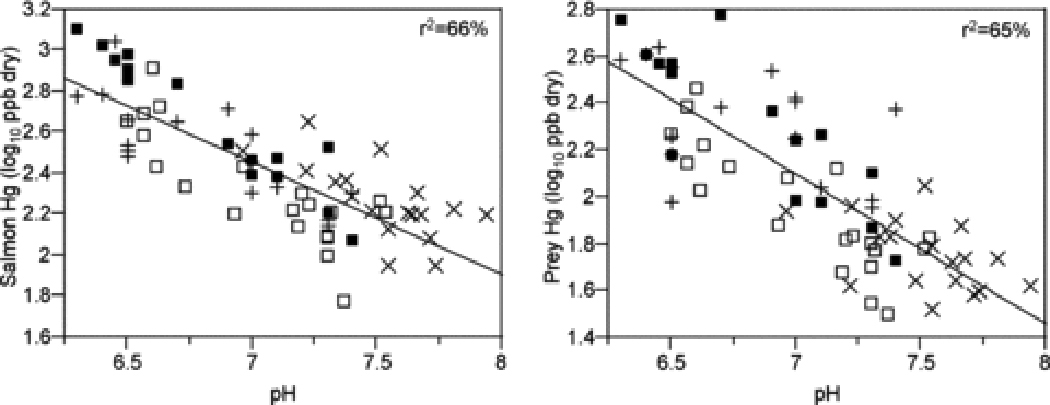
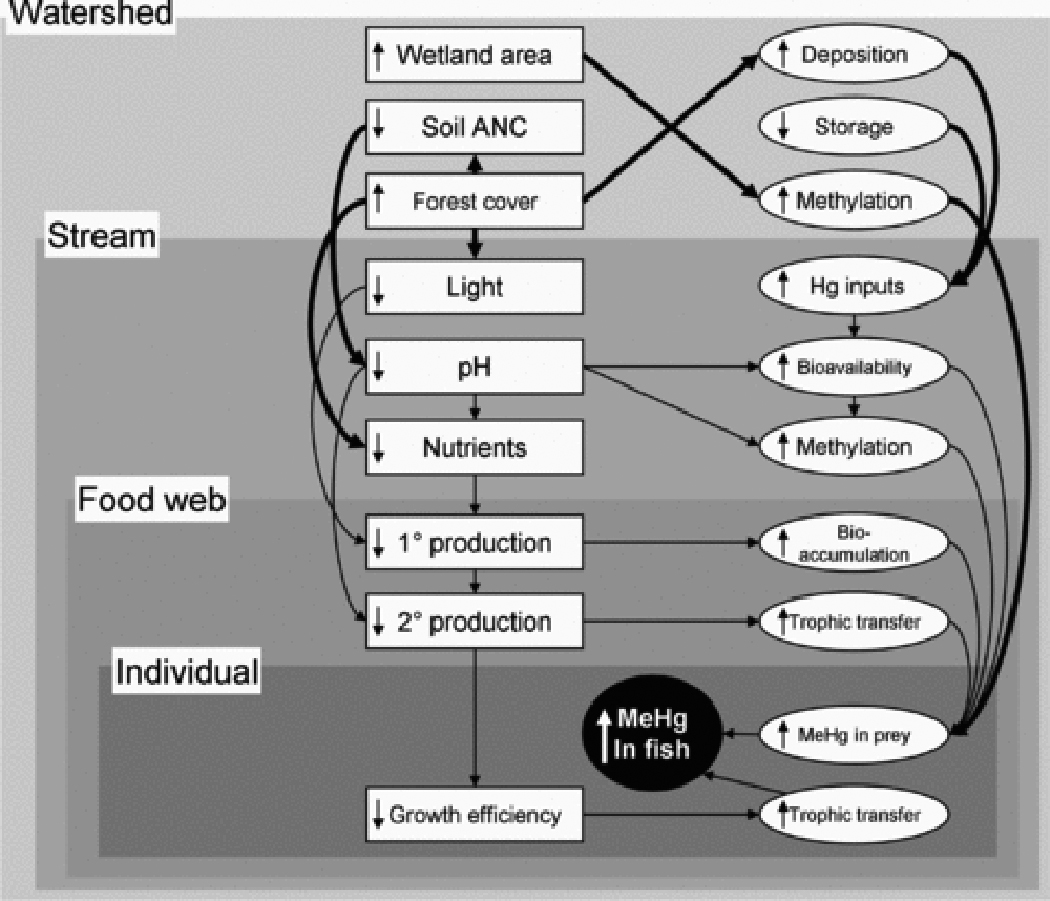
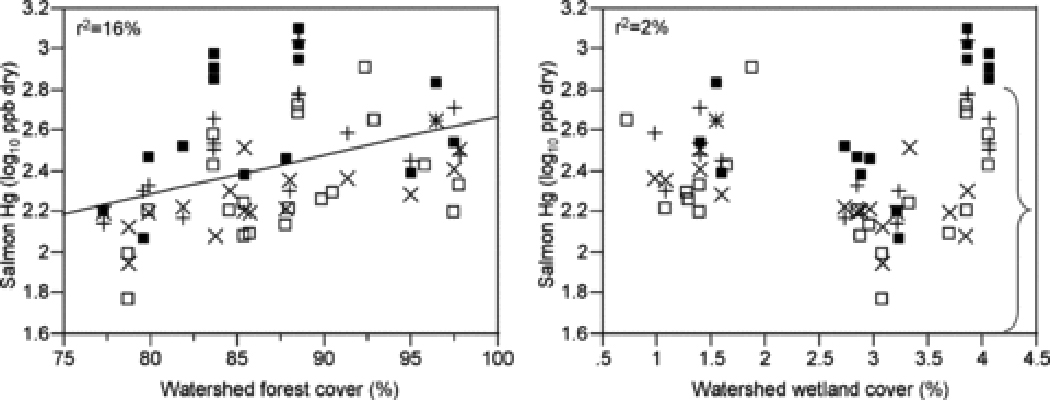
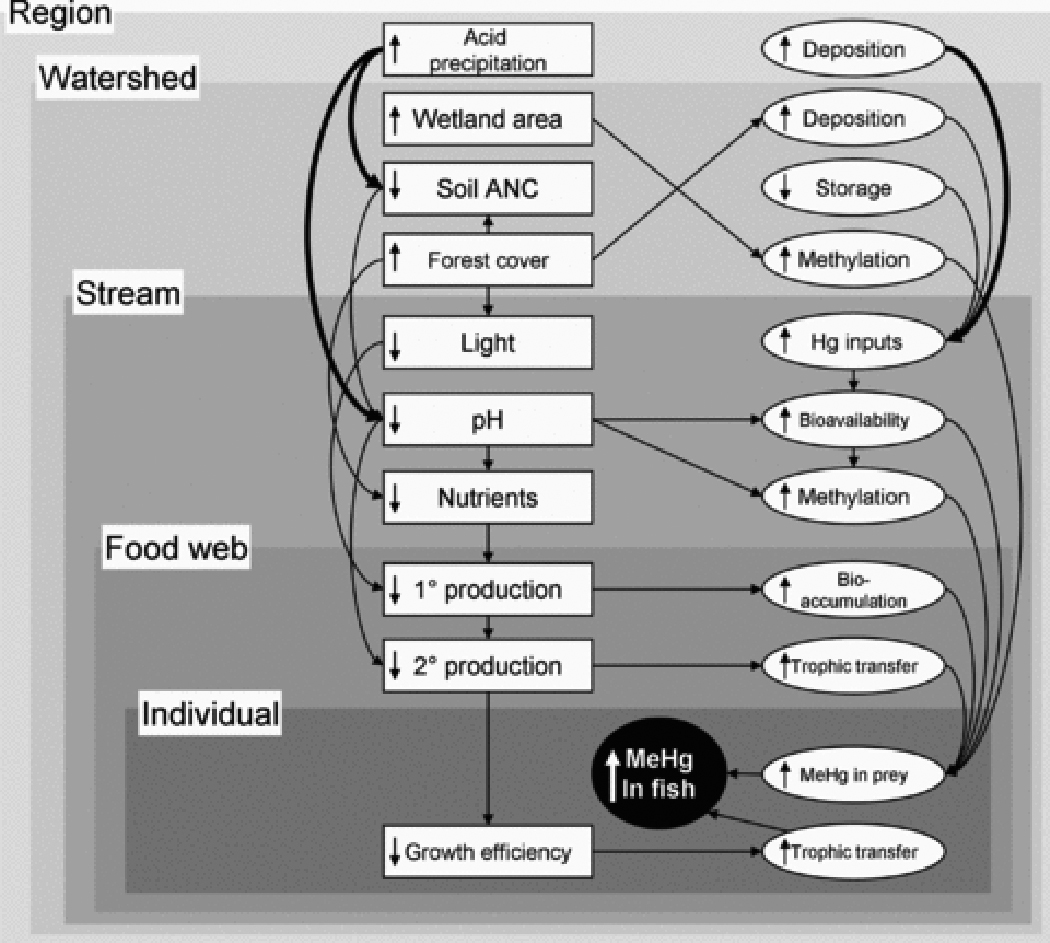
Mercury is a ubiquitous contaminant in aquatic ecosystems, posing a significant health risk to humans and wildlife that eat fish. Mercury accumulates in aquatic food webs as methylmercury (MeHg), a particularly toxic and persistent organic mercury compound. While mercury in the environment originates largely from anthropogenic activities, MeHg accumulation in freshwater aquatic food webs is not a simple function of local or regional mercury pollution inputs. Studies show that even sites with similar mercury inputs can produce fish with mercury concentrations ranging over an order of magnitude. While much of the foundational work to identify the drivers of variation in mercury accumulation has focused on freshwater lakes, mercury contamination in stream ecosystems is emerging as an important research area. Here, we review recent research on mercury accumulation in stream-dwelling organisms. Taking a hierarchical approach, we identify a suite of characteristics of individual consumers, food webs, streams, watersheds, and regions that are consistently associated with elevated MeHg concentrations in stream fish. We delineate a conceptual, mechanistic basis for explaining the ecological processes that underlie this vulnerability to MeHg. Key factors, including suppressed individual growth of consumers, low rates of primary and secondary production, hydrologic connection to methylation sites (e.g., wetlands), heavily forested catchments, and acidification are frequently associated with increased MeHg concentrations in fish across both streams and lakes. Hence, we propose that these interacting factors define a syndrome of characteristics that drive high MeHg production and bioaccumulation rates across these freshwater aquatic ecosystems. Finally, based on an understanding of the ecological drivers of MeHg accumulation, we identify situations when anthropogenic effects and management practices could significantly exacerbate or ameliorate MeHg accumulation in stream fish.
Figures

References
-
- US EPA. Washington, DC: U.S. EPA; 2009. 2008 Biennial national listing of fish advisories. Technical report EPA-823-F-09-007.
-
- Mergler D, et al. Methylmercury exposure and health effects in humans: A worldwide concern. Ambio. 2007;36:3–11. - PubMed
-
- Mozaffarian D, Rimm EB. Fish intake, contaminants, and human health: Evaluating the risks and the benefits. JAMA-J. Am. Med. Assoc. 2006;296:1885–1899. - PubMed
-
- Rees JR, Sturup S, Chen C, Folt C, Karagas MR. Toenail mercury and dietary fish consumption. J. Expo. Sci. Env. Epid. 2007;17:25–30. - PubMed
Publication types
MeSH terms
Substances
Grants and funding
LinkOut - more resources
Full Text Sources
Medical
