. 2010 Jun 10:10:60.
doi: 10.1186/1471-230X-10-60.

The role of T cell PPAR gamma in mice with experimental inflammatory bowel disease

Affiliations

The role of T cell PPAR gamma in mice with experimental inflammatory bowel disease

Amir J Guri et al. BMC Gastroenterol. .

Abstract

Background: Peroxisome proliferator-activated receptor gamma (PPAR gamma) is a nuclear receptor whose activation has been shown to modulate macrophage and T cell-mediated inflammation. The objective of this study was to investigate the mechanisms by which the deletion of PPAR gamma in T cells modulates immune cell distribution and colonic gene expression and the severity of experimental IBD.

Methods: PPAR gamma flfl; CD4 Cre+ (CD4cre) or Cre- (WT) mice were challenged with 2.5% dextran sodium sulfate in their drinking water for 0, 2, or 7 days. Mice were scored on disease severity both clinically and histopathologically. Flow cytometry was used to assess lymphocyte and macrophage populations in the blood, spleen, and mesenteric lymph nodes (MLN). Global gene expression in colonic mucosa was profiled using Affymetrix microarrays.

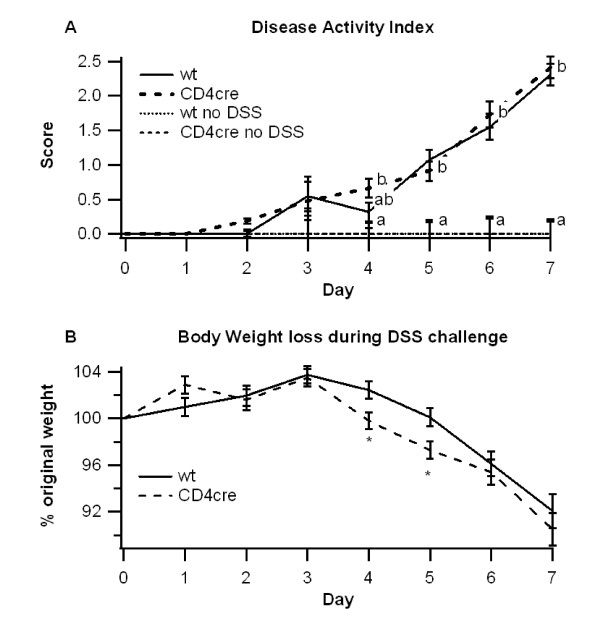
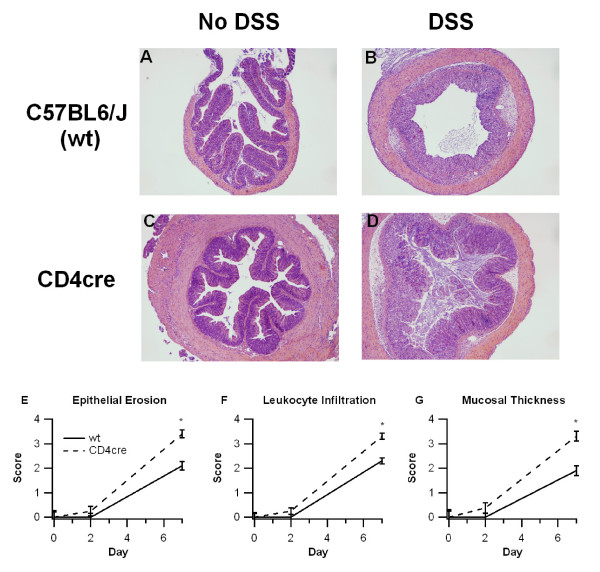
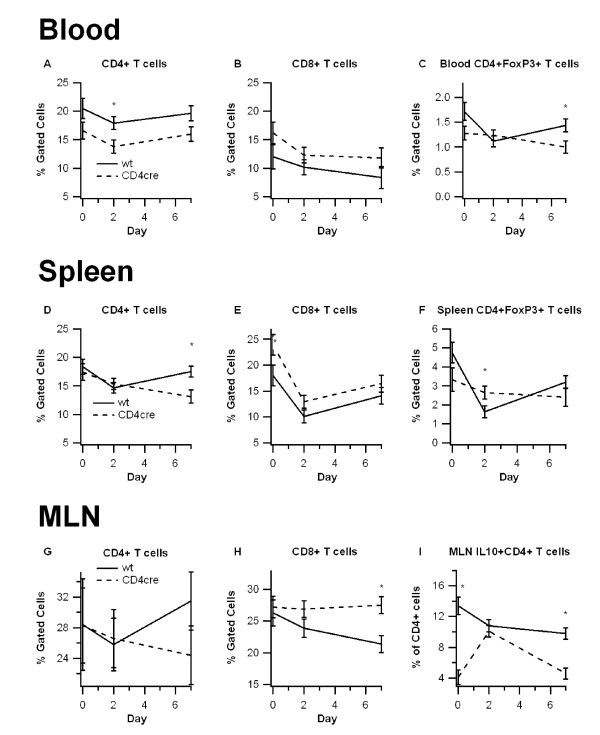
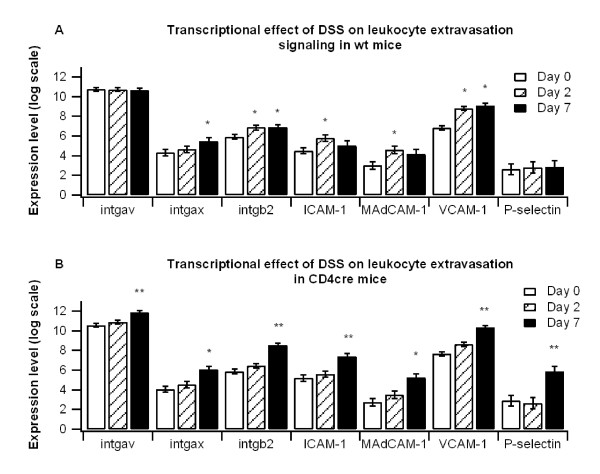
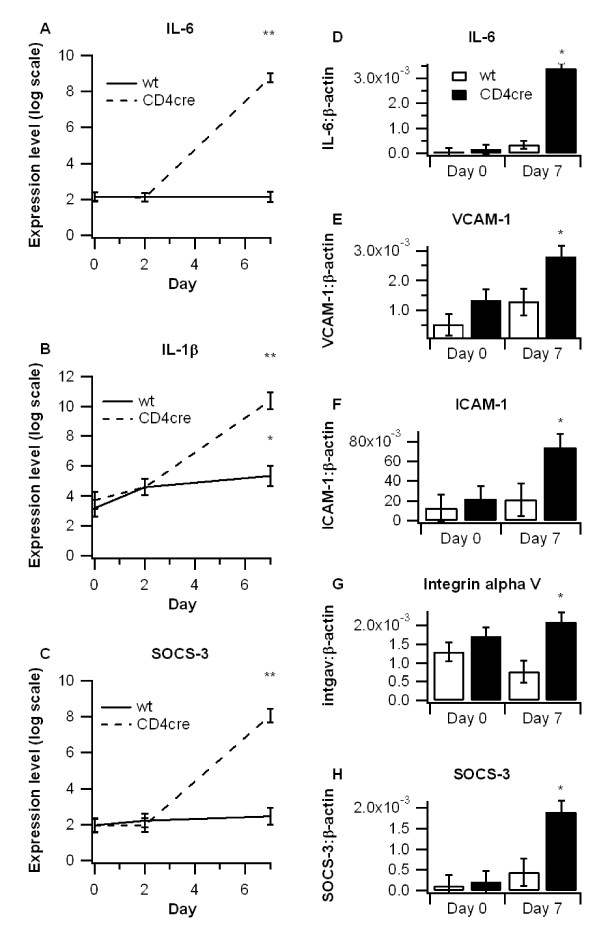
Results: The deficiency of PPAR gamma in T cells accelerated the onset of disease and body weight loss. Examination of colon histopathology revealed significantly greater epithelial erosion, leukocyte infiltration, and mucosal thickening in the CD4cre mice on day 7. CD4cre mice had more CD8+ T cells than WT mice and fewer CD4+ FoxP3+ regulatory T cells (Treg) and IL10+ CD4+ T cells in blood and MLN, respectively. Transcriptomic profiling revealed around 3000 genes being transcriptionally altered as a result of DSS challenge in CD4cre mice. These included up-regulated mRNA expression of adhesion molecules, proinflammatory cytokines interleukin-6 (IL-6) and IL-1beta, and suppressor of cytokine signaling 3 (SOCS-3) on day 7. Gene set enrichment analysis (GSEA) showed that the ribosome and Krebs cycle pathways were downregulated while the apoptosis pathway was upregulated in colons of mice lacking PPAR gamma in T cells.

Conclusions: The expression of PPAR gamma in T cells is involved in preventing gut inflammation by regulating colonic expression of adhesion molecules and inflammatory mediators at later stages of disease while favoring the recruitment of Treg to the mucosal inductive sites.


Figures

Figure 1
Figure 1
Effect of T cell-specific PPAR γ deletion on disease severity. WT or CD4cre mice were treated with 2.5% dextran sodium sulfate (DSS) or water (no DSS) for 7 days. The disease activity index (DAI), a composite score reflecting clinical signs of the disease (i.e. perianal soiling, rectal bleeding, diarrhea, and piloerection) was assessed daily (A) and the average daily loss in body weights (B) throughout the 7 day DSS challenge was calculated. Data are represented as mean ± standard error. Points with different subscripts are significantly different (P < 0.05).
Figure 2
Figure 2
Effect of T cell-specific PPAR γ deletion on colon histopathology. WT or CD4cre mice were treated with 2.5% dextran sodium sulfate (DSS) or water (no DSS) for 7 days. Representative photomicrographs (40 ×) from wt, no-DSS (A), wt, DSS (B), CD4cre, no-DSS (C), and CD4cre, DSS (D) groups are depicted. All specimens underwent blinded histological examination and were scored (1-4) on epithelial erosion (E), leukocyte infiltration (F), and mucosal wall thickening (G) on days 0, 2, and 7 of DSS challenge. Data are represented as mean ± standard error. Points with an asterisk are significantly different at a given time point (P < 0.05).
Figure 3
Figure 3
Effect of T cell-specific PPAR γ deletion on lymphocyte subsets in blood, spleen, and mesenteric lymph nodes (MLN). Blood (A-C), spleen (D-E), and MLN (F-H) from wild-type (WT) or PPAR γ flfl; CD4 Cre+ (CD4cre) mice were immunophenotyped with anti-CD3, anti-CD4, anti-CD8 antibodies, anti-F4/80, anti-CD11b, anti-FoxP3, and anti-IL10 to identify immune subsets through flow cytometry. Data were collected on days 0, 2, and 7 of DSS challenge and was analyzed with FACS Diva software. Data are represented as mean ± standard error. Points with an asterisk are significantly different at a given time point (P < 0.05).
Figure 4
Figure 4
Effect of T cell-specific PPAR γ deletion on leukocyte extravasation markers. WT or CD4cre mice were treated with 2.5% dextran sodium sulfate (DSS) for 7 days, and microarray analyses was performed. Colons of WT (A) and CD4cre (B) mice were assessed for leukocyte extravasation markers integrin alpha V (intgav), integrin alpha X (intgax), integrin beta 2 (intgb2), intracellular adhesion molecule 1 (ICAM-1), mucosal addressin adhesion molecule 1 (MAdCAM-1), vascular adhesion molecule 1 (VCAM-1) and P-selectin. Results from microarray were validated with real time PCR. Points with an asterisk are significantly different from the day 0 time point (P < 0.05). Points with a double asterisk also indicate a significant difference due to genotype at a given time point (P < 0.05).
Figure 5
Figure 5
Effect of T cell-specific PPAR γ deletion on inflammatory gene expression. WT or CD4cre mice were treated with 2.5% dextran sodium sulfate (DSS) for 7 days, and microarray analyses was performed on colon samples. Differences in interleukin 6 (IL-6) (A), IL-1β (B), and suppressor of cytokine signaling 3 (SOCS-3) (C) were compared among groups and validated with real time PCR. Expressions of (IL-6 (D), vascular adhesion molecule 1 (VCAM-1) (E), intracellular adhesion molecule 1 (ICAM-1) (F), integrin alpha V (intgav) (G), and SOCS-3 (H) on days 0 and 7 were examined by real time PCR to validate microarray findings. Points with an asterisk are significantly different from the day 0 time point (P < 0.05). Points with a double asterisk also indicate a significant difference due to genotype at a given time point (P < 0.05).

Similar articles

Cited by

References

    1. Hanauer SB. Inflammatory bowel disease: epidemiology, pathogenesis, and therapeutic opportunities. Inflamm Bowel Dis. 2006;12(Suppl 1):S3–9. doi: 10.1097/01.MIB.0000195385.19268.68. - DOI - PubMed
    1. Bassaganya-Riera J, Reynolds K, Martino-Catt S, Cui Y, Hennighausen L, Gonzalez F, Rohrer J, Benninghoff AU, Hontecillas R. Activation of PPAR gamma and delta by conjugated linoleic acid mediates protection from experimental inflammatory bowel disease. Gastroenterology. 2004;127(3):777–791. doi: 10.1053/j.gastro.2004.06.049. - DOI - PubMed
    1. Desreumaux P, Dubuquoy L. PPARgamma agonists as a new class of effective treatment for ulcerative colitis. Inflamm Bowel Dis. 2009;15(6):959–960. doi: 10.1002/ibd.20765. - DOI - PubMed
    1. Lewis JD, Lichtenstein GR, Deren JJ, Sands BE, Hanauer SB, Katz JA, Lashner B, Present DH, Chuai S, Ellenberg JH. et al.Rosiglitazone for active ulcerative colitis: a randomized placebo-controlled trial. Gastroenterology. 2008;134(3):688–695. - PMC - PubMed
    1. Straus DS, Glass CK. Anti-inflammatory actions of PPAR ligands: new insights on cellular and molecular mechanisms. Trends Immunol. 2007;28(12):551–558. doi: 10.1016/j.it.2007.09.003. - DOI - PubMed

Publication types

MeSH terms