. 2010 Jun 10:11:367.
doi: 10.1186/1471-2164-11-367.

The ubiquitin-conjugating enzyme HR6B is required for maintenance of X chromosome silencing in mouse spermatocytes and spermatids

Affiliations

The ubiquitin-conjugating enzyme HR6B is required for maintenance of X chromosome silencing in mouse spermatocytes and spermatids

Eskeatnaf Mulugeta Achame et al. BMC Genomics. .

Abstract

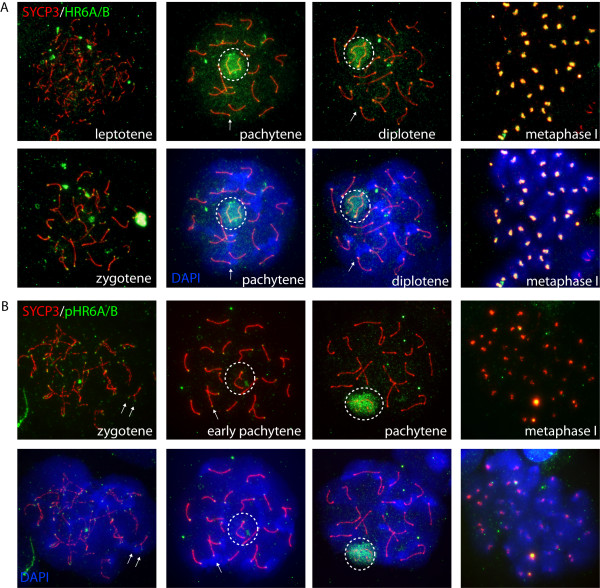
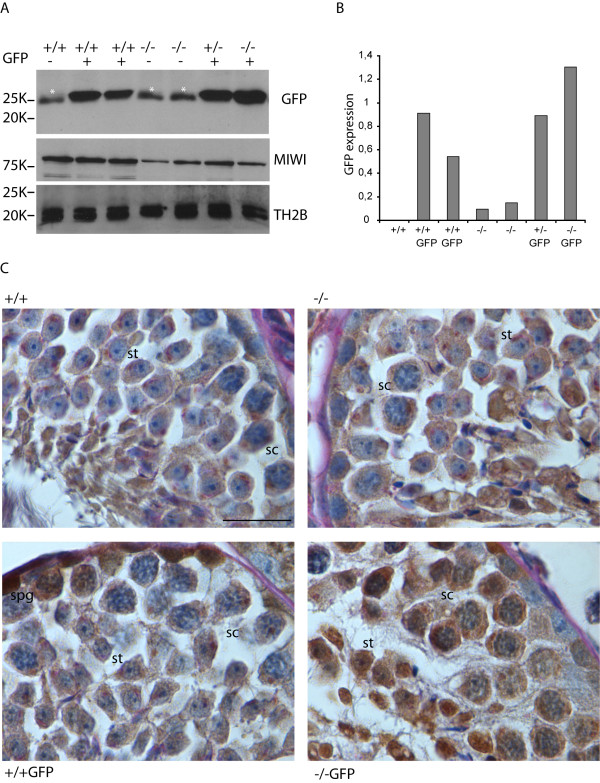
Background: The ubiquitin-conjugating enzyme HR6B is required for spermatogenesis in mouse. Loss of HR6B results in aberrant histone modification patterns on the trancriptionally silenced X and Y chromosomes (XY body) and on centromeric chromatin in meiotic prophase. We studied the relationship between these chromatin modifications and their effects on global gene expression patterns, in spermatocytes and spermatids.

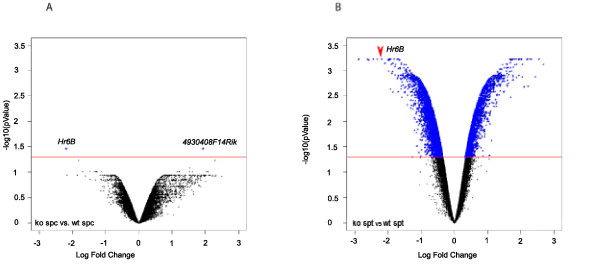
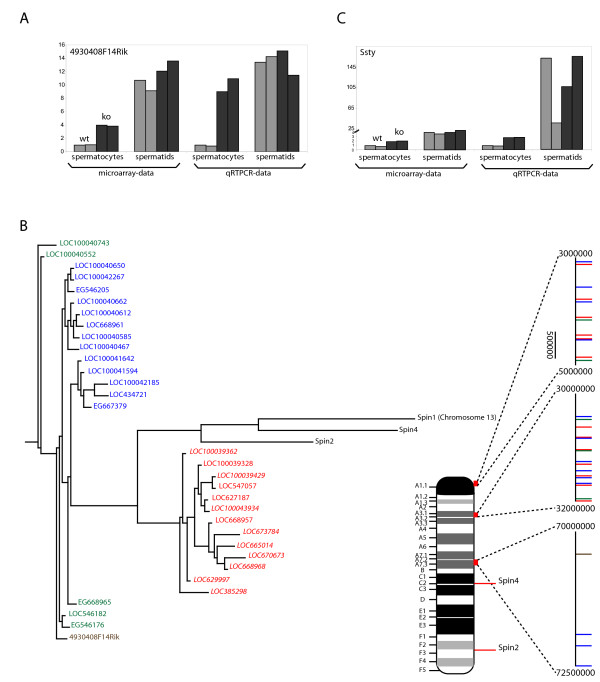
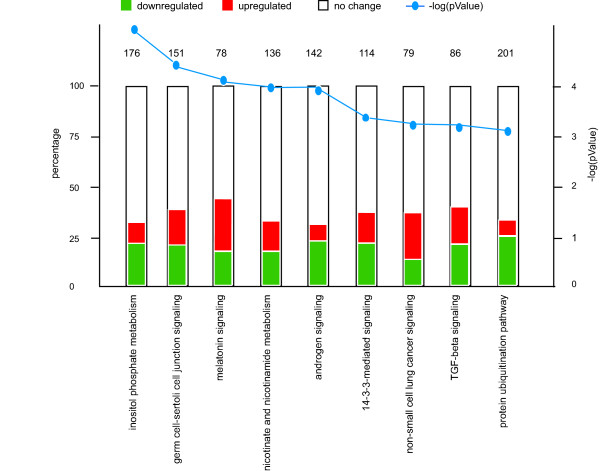
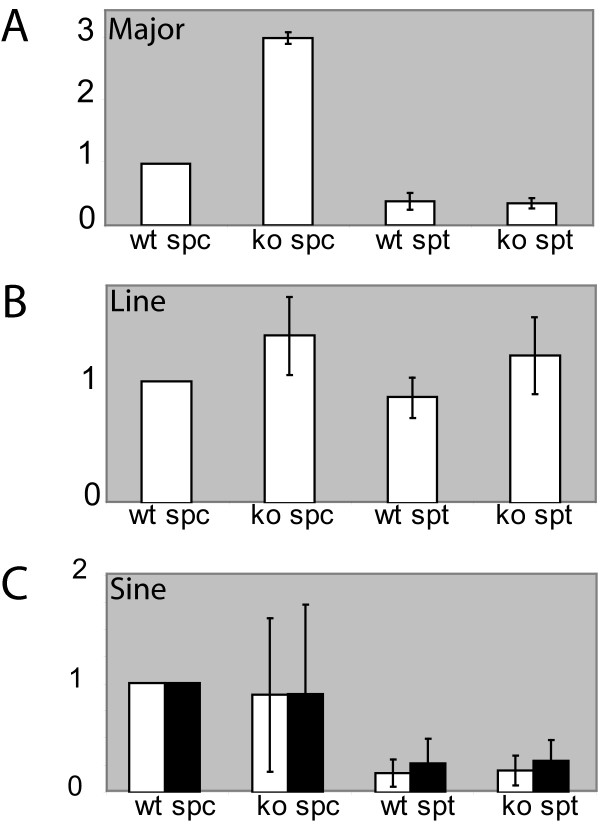
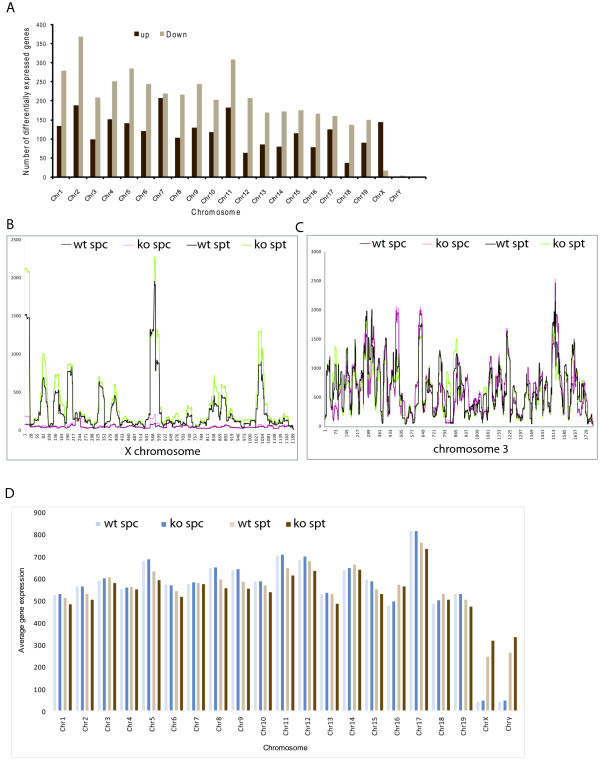
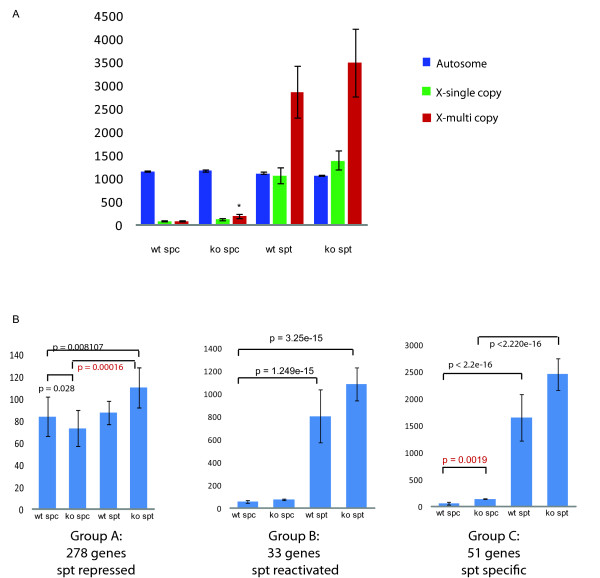
Results: HR6B is enriched on the XY body and on centromeric regions in pachytene spermatocytes. Global gene expression analyses revealed that spermatid-specific single- and multicopy X-linked genes are prematurely expressed in Hr6b knockout spermatocytes. Very few other differences in gene expression were observed in these cells, except for upregulation of major satellite repeat transcription. In contrast, in Hr6b knockout spermatids, 7298 genes were differentially expressed; 65% of these genes was downregulated, but we observed a global upregulation of gene transcription from the X chromosome. In wild type spermatids, approximately 20% of the single-copy X-linked genes reach an average expression level that is similar to the average expression from autosomes.

Conclusions: Spermatids maintain an enrichment of repressive chromatin marks on the X chromosome, originating from meiotic prophase, but this does not interfere with transcription of the single-copy X-linked genes that are reactivated or specifically activated in spermatids. HR6B represses major satellite repeat transcription in spermatocytes, and functions in the maintenance of X chromosome silencing in spermatocytes and spermatids. It is discussed that these functions involve modification of chromatin structure, possibly including H2B ubiquitylation.


Figures

Figure 1
Figure 1
HR6A/B localizes to centromeric chromatin in early pachytene. A, B: Immunostaining of spread spermatocyte nuclei for nonphosphorylated HR6A/B (green, A), phosphorylated HR6A/B (green, B), and SYCP3 (red A, B), The merge with DAPI (blue) staining for DNA is shown for a selection of nuclei. The centromeric ends of the SCs can be identified based on the more intense DAPI staining. Arrows indicate centromeric ends that are positive for phosphorylated and non-phosphorylated HR6A/B. The XY body is encircled. During leptotene and zygotene, both phosphorylated and nonphosphorylated HR6A/B accumulate as foci in the nucleus and on the developing SCs. Some centromeric and telomeric ends of the SCs also are enriched for phosphorylated and non-phosphorylated HR6A/B. During early pachytene, the XY body is not enriched for phosphorylated HR6A/B. At this stage, a clear accumulation of phosphorylated HR6A/B is observed on the centromeric ends of the SC. During late pachytene, this staining is lost, and phosphorylated and non-phosphorylated HR6A/B are prominent on the XY body. At metaphase of the first meiotic division, HR6A/B is highly enriched at centromeres, but not phosphorylated.
Figure 2
Figure 2
Volcano plots of p-values (corrected for false discovery) against log2 fold changes. The log2 fold change is displayed on the x-axis and -log10(p-value), representing the probability that the gene is differentially expressed, on the y-axis. The blue labels indicate genes that are differentially expressed, with a p-value > 0.05. Red lines indicate the p-value cutoff point (0.05; -log10(0.05) = 1.30103). A: Plot showing the p-values derived from the comparison between late spermatocytes from wild type (wt) and Hr6b knockout (ko),. Only two differentially expressed genes were found, shown as blue dots. B: Plot showing the p-values derived from the comparison between round spermatids (spt) from wildtype (wt) and Hr6b knockout (ko). All 7289 differentially expressed genes are shown as blue dots.
Figure 3
Figure 3
Premature expression of the X-linked multicopy spindlin-like gene in Hr6b knockout spermatocytes. A: Comparision between the array data and qRTPCR data of 4930408F14Rik mRNA expression in two batches of wild type and Hr6b knockout spermatocytes and spermatids. B: Graphic representation of the localization of the multicopy Spin gene family on the mouse X chromosome. C: Comparision between the array data and Q-RTPCR data of Ssty1 mRNA expression in two batches of wild type and Hr6b knockout spermatocytes and spermatids.
Figure 4
Figure 4
Pathway analysis. Differentially expressed genes were uploaded to Ingenuity pathways analysis software. The top 9 pathways are displayed, and the full table is available as additional data file 3. The canonical pathways that are involved in this analysis are displayed along the x-axis. On the y-axis, the percentage of genes that are up- or downregulated is represented. Red shows upregulated, green shows downregulated. The number on the bar graph shows the number of known genes in this pathway, e.g. from the 201 genes that are involved in protein ubiquitination 49 are downregulated and 16 are upregulated; the other 136 genes that are involved in this pathway are not uploaded to Ingenuity because they were not differentially expressed, or for other annotation reasons. The blue line shows the -log (p-value), and the scale shown on the right side of the graph.
Figure 5
Figure 5
HR6A/B represses transcription of major satellite repeats in spermatocytes. Expression of major satellite (A), Line L1 (B), Sine B1 (white bars, C), and Sine B2 (black bars, C) repeats was analysed using Q-RTPCR. The values of all samples were first normalized against β-actin, and subsequently the average value of wild type spermatocytes was set at 1. Error bars indicate the standard deviation.
Figure 6
Figure 6
Global upregulation of X-linked genes in Hr6b knockout spermatocytes. A) Number of differentially expressed genes per chromosome. Significantly expressed genes were annotated and plotted per chromosome. Except for chromosome 7 and chromosome X, the number of downregulated genes in the Hr6b knockout is higher than in wild type spermatids. A reverse effect is observed for chromosome X, where the number of upregulated genes in knockout round spermatids is higher than in wild type. Green, downregulated in knockout. Red, upregulated in knockout. B, C) The expression profile along chromosome X (B) and 3 (C) in wild type and Hr6b knockout spermatocytes and round spermatids. Gene expression data (linear scale) were mapped to the genomic location of each gene (Affymetrix annotation). D) Average expression per chromosome. RMA normalized average expression for each chromosome was calculated and plotted. Average expression, linear scale, is plotted on the y-axis, and chromosome numbers are shown on the x-axis. The late spermatocytes showed very few and variable changes in average gene expression per chromosome. For round spermatids, the average expression on all chromosomes is slightly higher in wild type, except on chromosome 7 and chromosome X. On chromosome 7 the average expression is equal in wild type and knockout round spermatids. On chromosome X, the average expression is significantly higher in knockout round spermatids. Abbreviations: wt, spt, round spermatid wild type; ko spt, round spermatid Hr6b knockout; wt spc, spermatocyte wild type; ko spc, spermatocyte Hr6b knockout.
Figure 7
Figure 7
Analysis of X-linked single-copy and multicopy genes. A) Average gene expression of autosomal and X-linked multicopy and single-copy genes. In spermatocytes, there is a significant increase in the average expression level of multicopy genes in the knockout compared to wild type. This increase was not observed for single-copy genes. In round spermatids, there is a small increase in the average expression level of both single-copy and multicopy X-linked genes of Hr6b knockout compared to wildtype, but this is not statistically significant. The autosomes have a similar average expression in all samples. Genes with an expression value <100 in 3 or more samples were excluded. Asterisk indicates significant compared to wild type (p = 0.05). B) The effect of Hr6b knockout on X-linked genes that are repressed in round spermatids (Group A, 278 genes), reactivated in round spermatids (Group B, 33 genes), and genes that are expressed specifically in round spermatids (Group C, 51 genes) as classified by [34]. For group A genes, postmeiotic induction of gene expression is observed only for Hr6b knockout spermatids. For group B and C genes a small increase in the average expression was observed in Hr6b knockout spermatids, compared to wild type spermatids, but this was not statistically significant. In addition, spermatid-specific X-linked genes show premature expression in spermatocytes of Hr6b knockout mice (p = 0.0019)
Figure 8
Figure 8
Enhanced X-linked GFP expression in Hr6b knockout testes. A, Western blot analyses of X-GFP, MIWI and TH2B expression in protein extracts derived from wild type (+/+) Hr6b+/- (+/-) and Hr6b-/- (-/-) mouse testes with or without the X-linked GFP transgene (GFP). MIWI (expressed in spermatocytes and early round spermatids) and TH2B (expressed from the spermatogonia stage onwards) are shown as controls. The white asterisks indicate a nonspecific band migrating slightly faster than the GFP band. B, quantification of the Western blot data shown in A. GFP signal was quantified using Image J software. The intensity of the background band in lane 1 was subtracted from the GFP signal in all lanes. Subsequently, the signal was normalized to the TH2B signal, and is shown on the Y-axis of the graph. C, immunohistochemical analyses of GFP expression in testis from mice that are wild type (+/+), wild type carrying X-GFP (+/+GFP), Hr6b knockout (-/-), or Hr6b knockout carrying X-GFP (-/-GFP). Al low level of nonspecific background brown staining is observed in the +/+ and -/- testes. Specific brown GFP staining is observed in spermatogonia (spg) in wild type mice carrying the X-GFP gene, but also in pachytene spermatocytes (spc) and round spermatids (spt) on the Hr6b knockout background. Size bar indicates 20 μm.

Similar articles

Cited by

References

    1. Koken MH, Reynolds P, Jaspers-Dekker I, Prakash L, Prakash S, Bootsma D, Hoeijmakers JH. Structural and functional conservation of two human homologs of the yeast DNA repair gene RAD6. Proc Natl Acad Sci USA. 1991;88(20):8865–8869. doi: 10.1073/pnas.88.20.8865. - DOI - PMC - PubMed
    1. Varshavsky A. Regulated protein degradation. Trends Biochem Sci. 2005;30(6):283–286. doi: 10.1016/j.tibs.2005.04.005. - DOI - PubMed
    1. Pickart CM, Fushman D. Polyubiquitin chains: polymeric protein signals. Curr Opin Chem Biol. 2004;8(6):610–616. doi: 10.1016/j.cbpa.2004.09.009. - DOI - PubMed
    1. Varshavsky A. The N-end rule pathway of protein degradation. Genes Cells. 1997;2(1):13–28. doi: 10.1046/j.1365-2443.1997.1020301.x. - DOI - PubMed
    1. Hoege C, Pfander B, Moldovan GL, Pyrowolakis G, Jentsch S. RAD6-dependent DNA repair is linked to modification of PCNA by ubiquitin and SUMO. Nature. 2002;419(6903):135–141. doi: 10.1038/nature00991. - DOI - PubMed

Publication types

MeSH terms