

A novel chemogenomics analysis of G protein-coupled receptors (GPCRs) and their ligands: a potential strategy for receptor de-orphanization
- PMID: 20537162
- PMCID: PMC2897831
- DOI: 10.1186/1471-2105-11-316
A novel chemogenomics analysis of G protein-coupled receptors (GPCRs) and their ligands: a potential strategy for receptor de-orphanization
Abstract
Background: G protein-coupled receptors (GPCRs) represent a family of well-characterized drug targets with significant therapeutic value. Phylogenetic classifications may help to understand the characteristics of individual GPCRs and their subtypes. Previous phylogenetic classifications were all based on the sequences of receptors, adding only minor information about the ligand binding properties of the receptors. In this work, we compare a sequence-based classification of receptors to a ligand-based classification of the same group of receptors, and evaluate the potential to use sequence relatedness as a predictor for ligand interactions thus aiding the quest for ligands of orphan receptors.
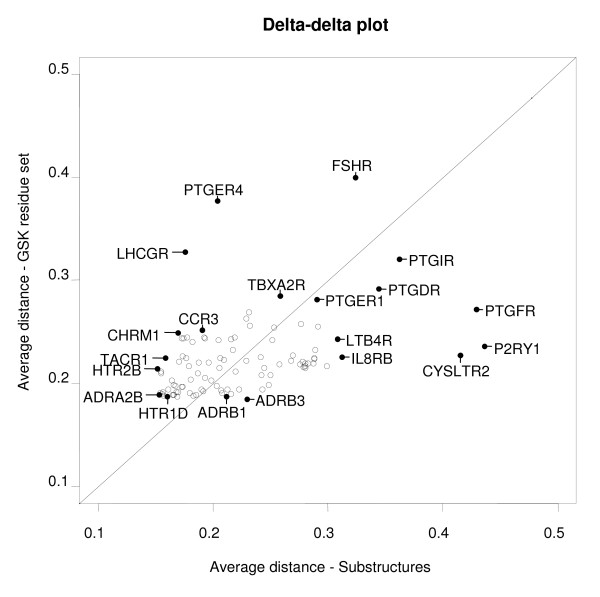
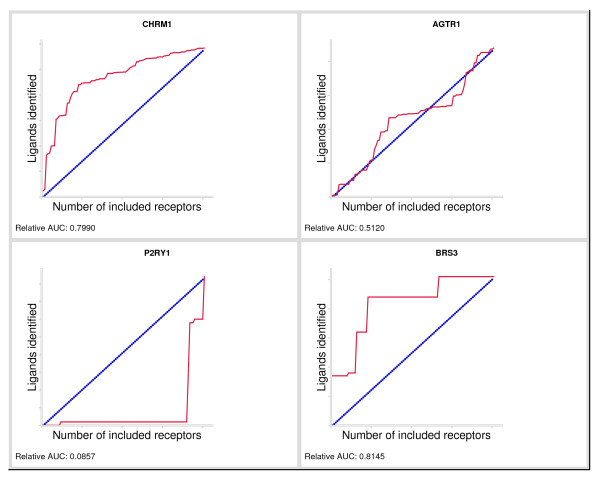
Results: We present a classification of GPCRs that is purely based on their ligands, complementing sequence-based phylogenetic classifications of these receptors. Targets were hierarchically classified into phylogenetic trees, for both sequence space and ligand (substructure) space. The overall organization of the sequence-based tree and substructure-based tree was similar; in particular, the adenosine receptors cluster together as well as most peptide receptor subtypes (e.g. opioid, somatostatin) and adrenoceptor subtypes. In ligand space, the prostanoid and cannabinoid receptors are more distant from the other targets, whereas the tachykinin receptors, the oxytocin receptor, and serotonin receptors are closer to the other targets, which is indicative for ligand promiscuity. In 93% of the receptors studied, de-orphanization of a simulated orphan receptor using the ligands of related receptors performed better than random (AUC > 0.5) and for 35% of receptors de-orphanization performance was good (AUC > 0.7).
Conclusions: We constructed a phylogenetic classification of GPCRs that is solely based on the ligands of these receptors. The similarities and differences with traditional sequence-based classifications were investigated: our ligand-based classification uncovers relationships among GPCRs that are not apparent from the sequence-based classification. This will shed light on potential cross-reactivity of GPCR ligands and will aid the design of new ligands with the desired activity profiles. In addition, we linked the ligand-based classification with a ligand-focused sequence-based classification described in literature and proved the potential of this method for de-orphanization of GPCRs.
Figures


Similar articles
-
A structural chemogenomics analysis of aminergic GPCRs: lessons for histamine receptor ligand design.Br J Pharmacol. 2013 Sep;170(1):101-26. doi: 10.1111/bph.12248. Br J Pharmacol. 2013. PMID: 23713847 Free PMC article.
-
A chemogenomic analysis of the transmembrane binding cavity of human G-protein-coupled receptors.Proteins. 2006 Feb 1;62(2):509-38. doi: 10.1002/prot.20768. Proteins. 2006. PMID: 16294340
-
A Structural Framework for GPCR Chemogenomics: What's In a Residue Number?Methods Mol Biol. 2018;1705:73-113. doi: 10.1007/978-1-4939-7465-8_4. Methods Mol Biol. 2018. PMID: 29188559
-
Chemogenomic approaches for the exploration of GPCR space.Curr Top Med Chem. 2011;11(15):1944-55. doi: 10.2174/156802611796391212. Curr Top Med Chem. 2011. PMID: 21470168 Review.
-
Drug design of GPCR ligands using physicogenetics and chemogenomics--principles and case studies.Curr Top Med Chem. 2011;11(15):1882-901. doi: 10.2174/156802611796391258. Curr Top Med Chem. 2011. PMID: 21470174 Review.
Cited by
-
Exploring the ligand-protein networks in traditional chinese medicine: current databases, methods, and applications.Evid Based Complement Alternat Med. 2013;2013:806072. doi: 10.1155/2013/806072. Epub 2013 Jun 2. Evid Based Complement Alternat Med. 2013. PMID: 23818932 Free PMC article.
-
Chemogenomic analysis of G-protein coupled receptors and their ligands deciphers locks and keys governing diverse aspects of signalling.PLoS One. 2011 Feb 4;6(2):e16811. doi: 10.1371/journal.pone.0016811. PLoS One. 2011. PMID: 21326864 Free PMC article.
-
Benchmarking of protein descriptor sets in proteochemometric modeling (part 2): modeling performance of 13 amino acid descriptor sets.J Cheminform. 2013 Sep 24;5(1):42. doi: 10.1186/1758-2946-5-42. J Cheminform. 2013. PMID: 24059743 Free PMC article.
-
A pharmacological organization of G protein-coupled receptors.Nat Methods. 2013 Feb;10(2):140-6. doi: 10.1038/nmeth.2324. Epub 2013 Jan 6. Nat Methods. 2013. PMID: 23291723 Free PMC article.
-
GPCR ontology: development and application of a G protein-coupled receptor pharmacology knowledge framework.Bioinformatics. 2013 Dec 15;29(24):3211-9. doi: 10.1093/bioinformatics/btt565. Epub 2013 Sep 29. Bioinformatics. 2013. PMID: 24078711 Free PMC article.
References
-
- Jacoby E, Bouhelal R, Gerspacher M, Seuwen K. The 7 TM G-Protein-Coupled Receptor Target Family. Chem Med Chem. 2006;1(8):760–782. - PubMed
Publication types
MeSH terms
Substances
LinkOut - more resources
Full Text Sources
