

Comparison of three methods for ascertainment of contact information relevant to respiratory pathogen transmission in encounter networks
- PMID: 20537186
- PMCID: PMC2893181
- DOI: 10.1186/1471-2334-10-166
Comparison of three methods for ascertainment of contact information relevant to respiratory pathogen transmission in encounter networks
Abstract
Background: Mathematical models of infection that consider targeted interventions are exquisitely dependent on the assumed mixing patterns of the population. We report on a pilot study designed to assess three different methods (one retrospective, two prospective) for obtaining contact data relevant to the determination of these mixing patterns.
Methods: 65 adults were asked to record their social encounters in each location visited during 6 study days using a novel method whereby a change in physical location of the study participant triggered data entry. Using a cross-over design, all participants recorded encounters on 3 days in a paper diary and 3 days using an electronic recording device (PDA). Participants were randomised to first prospective recording method.
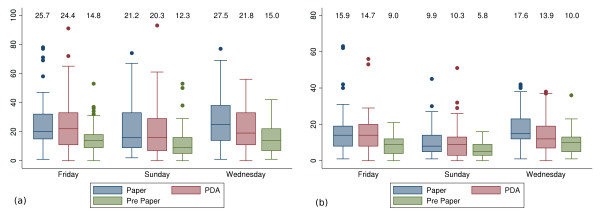
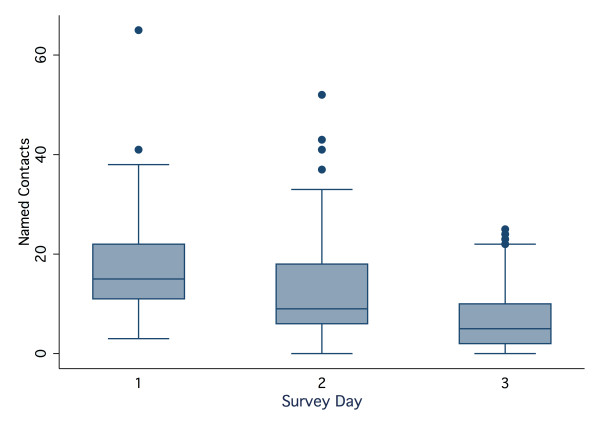
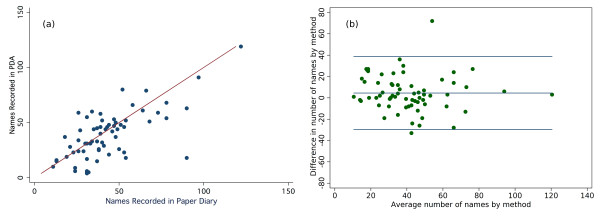
Results: Both methods captured more contacts than a pre-study questionnaire, but ascertainment using the paper diary was superior to the PDA (mean difference: 4.52 (95% CI 0.28, 8.77). Paper diaries were found more acceptable to the participants compared with the PDA. Statistical analysis confirms that our results are broadly consistent with those reported from large-scale European based surveys. An association between household size (trend 0.14, 95% CI (0.06, 0.22), P < 0.001) and composition (presence of child 0.37, 95% CI (0.17, 0.56), P < 0.001) and the total number of reported contacts was observed, highlighting the importance of sampling study populations based on household characteristics as well as age. New contacts were still being recorded on the third study day, but compliance had declined, indicating that the optimal number of sample days represents a trade-off between completeness and quality of data for an individual.
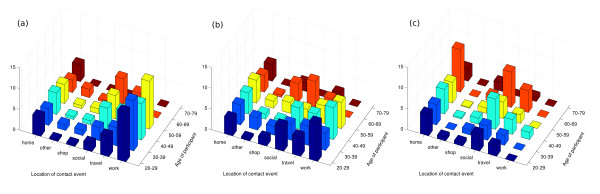
Conclusions: The study's location-based reporting design allows greater scope compared to other methods for examining differences in the characteristics of encounters over a range of environments. Improved parameterisation of dynamic transmission models gained from work of this type will aid in the development of more robust decision support tools to assist health policy makers and planners.
Figures
Similar articles
-
Social contacts and mixing patterns in rural Gambia.BMC Infect Dis. 2025 Feb 20;25(1):243. doi: 10.1186/s12879-025-10640-z. BMC Infect Dis. 2025. PMID: 39979860 Free PMC article.
-
How should social mixing be measured: comparing web-based survey and sensor-based methods.BMC Infect Dis. 2014 Mar 10;14:136. doi: 10.1186/1471-2334-14-136. BMC Infect Dis. 2014. PMID: 24612900 Free PMC article.
-
Social contacts and mixing patterns relevant to the spread of infectious diseases.PLoS Med. 2008 Mar 25;5(3):e74. doi: 10.1371/journal.pmed.0050074. PLoS Med. 2008. PMID: 18366252 Free PMC article.
-
Close encounters of the infectious kind: methods to measure social mixing behaviour.Epidemiol Infect. 2012 Dec;140(12):2117-30. doi: 10.1017/S0950268812000842. Epub 2012 Jun 12. Epidemiol Infect. 2012. PMID: 22687447 Free PMC article. Review.
-
Role of contact tracing and prevention strategies in the interruption of leprosy transmission.Lepr Rev. 2014 Mar;85(1):2-17. Lepr Rev. 2014. PMID: 24974438
Cited by
-
Linking contact behavior and droplet patterns to dynamically model indoor respiratory infections among schoolchildren.J Epidemiol. 2013;23(4):251-61. doi: 10.2188/jea.je20120031. Epub 2013 Jun 1. J Epidemiol. 2013. PMID: 23728484 Free PMC article.
-
Description of social contacts among student cases of pandemic influenza during the containment phase, Melbourne, Australia, 2009.Western Pac Surveill Response J. 2018 Oct 1;9(5 Suppl 1):27-34. doi: 10.5365/wpsar.2018.9.5.003. eCollection 2018 Winter. Western Pac Surveill Response J. 2018. PMID: 31832251 Free PMC article.
-
Online respondent-driven sampling for studying contact patterns relevant for the spread of close-contact pathogens: a pilot study in Thailand.PLoS One. 2014 Jan 8;9(1):e85256. doi: 10.1371/journal.pone.0085256. eCollection 2014. PLoS One. 2014. PMID: 24416371 Free PMC article.
-
Spatiotemporal heterogeneity of social contact patterns related to infectious diseases in the Guangdong Province, China.Sci Rep. 2020 Apr 15;10(1):6119. doi: 10.1038/s41598-020-63383-z. Sci Rep. 2020. PMID: 32296083 Free PMC article.
-
Behavioural response in educated young adults towards influenza A(H1N1)pdm09.Epidemiol Infect. 2015 Jul;143(9):1846-57. doi: 10.1017/S0950268814002714. Epub 2014 Oct 31. Epidemiol Infect. 2015. PMID: 25359684 Free PMC article.
References
-
- Becker NG, Glass K, Barnes B, Caley P, Philp D, McCaw JM, McVernon J, Wood J. Using Mathematical Models to Assess Responses to an Outbreak of an Emerged Viral Respiratory Disease. Final Report to the Australian Government Department of Health and Ageing. National Centre for Epidemiology and Population Health, Australian National University; 2006.
Publication types
MeSH terms
LinkOut - more resources
Full Text Sources
